As faculty and administrators with Calibrate access, you can easily access cohort report progress from early to late assessment. You can drill down to a high-level view of individual student performance, including a flag for which students are on or off track with summarized performance notes to inform conversations. Item-level reports allow for exploration across one or multiple cohorts and help identify curricular strengths and gaps.
You can access the Educator Report directly from the Assessment Dashboard:
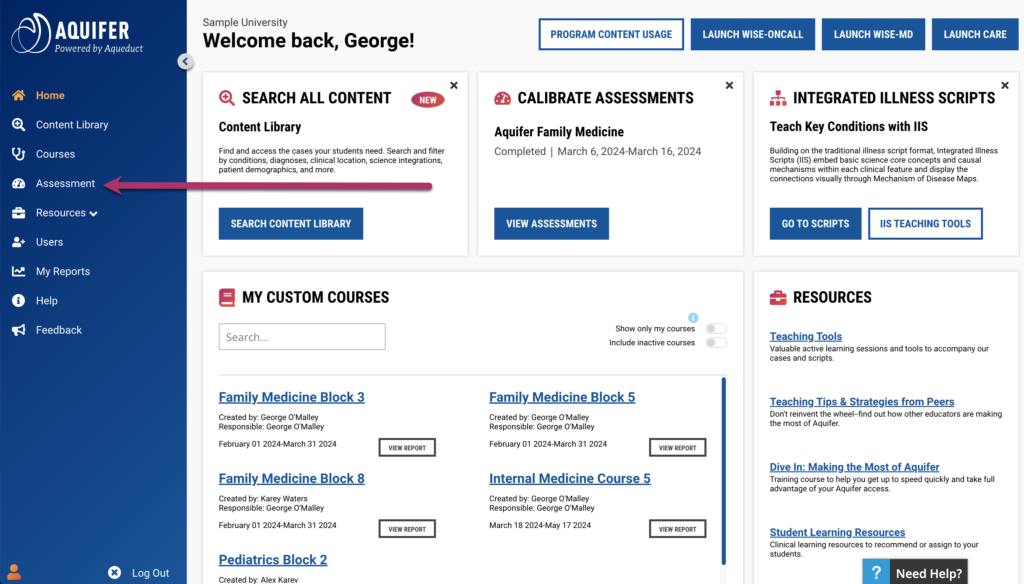
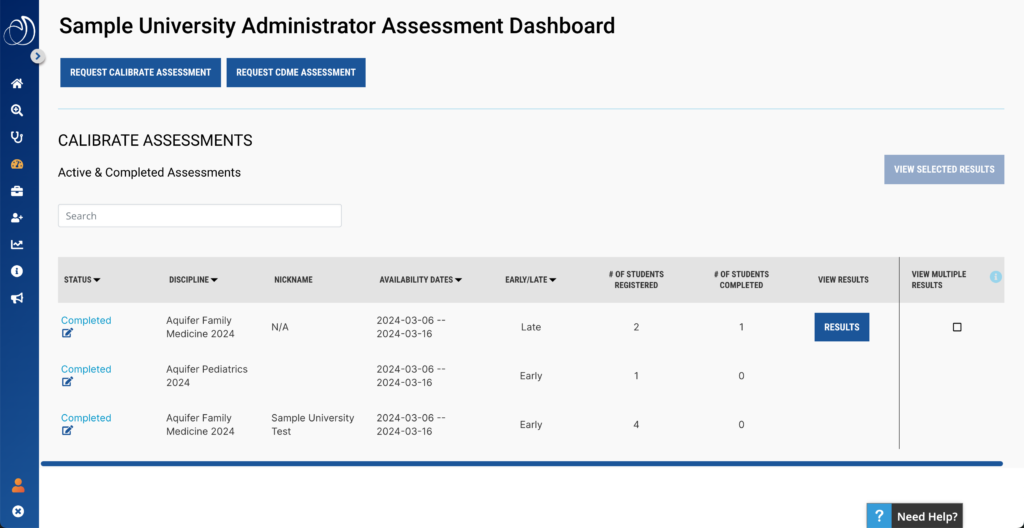
To view the Educator Reports, click the blue Results Button next to the assessment. If you would like to select multiple assessments for comparison purposes, tick the checkbox next to the Results button for each assessment and then click the “View Selected Results” button.
The Cohort Progress Summary
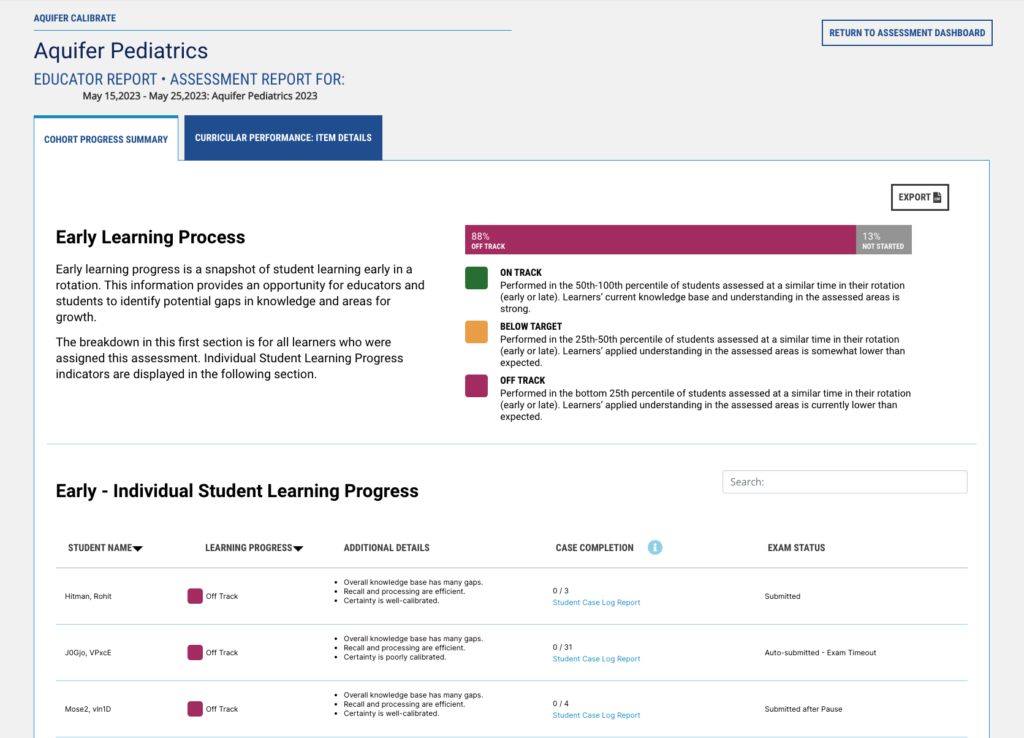
When you select the first or early assessment results, you see two tabs, the first is the Cohort Progress Summary. The second is the Curricular Performance: Item Details.
The progress summary tab shows a snapshot of the student’s learning early in a rotation. You and your students can use this information to identify potential gaps in knowledge and areas for growth. The report provides a breakdown for every student who was assigned the assessment.
Curricular Performance: Item Details
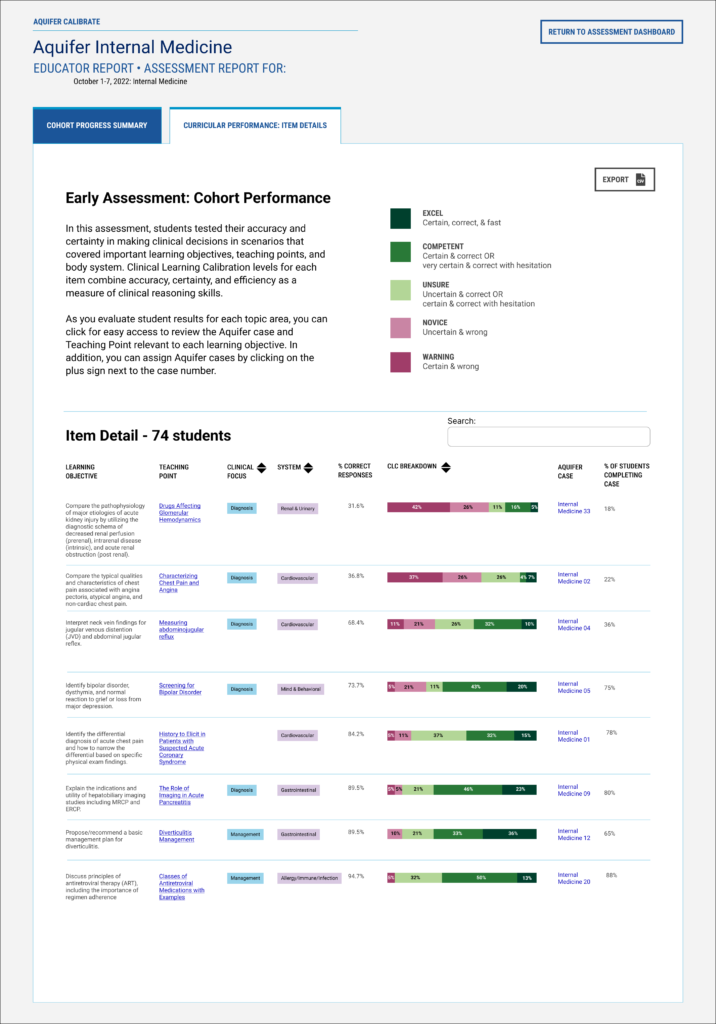
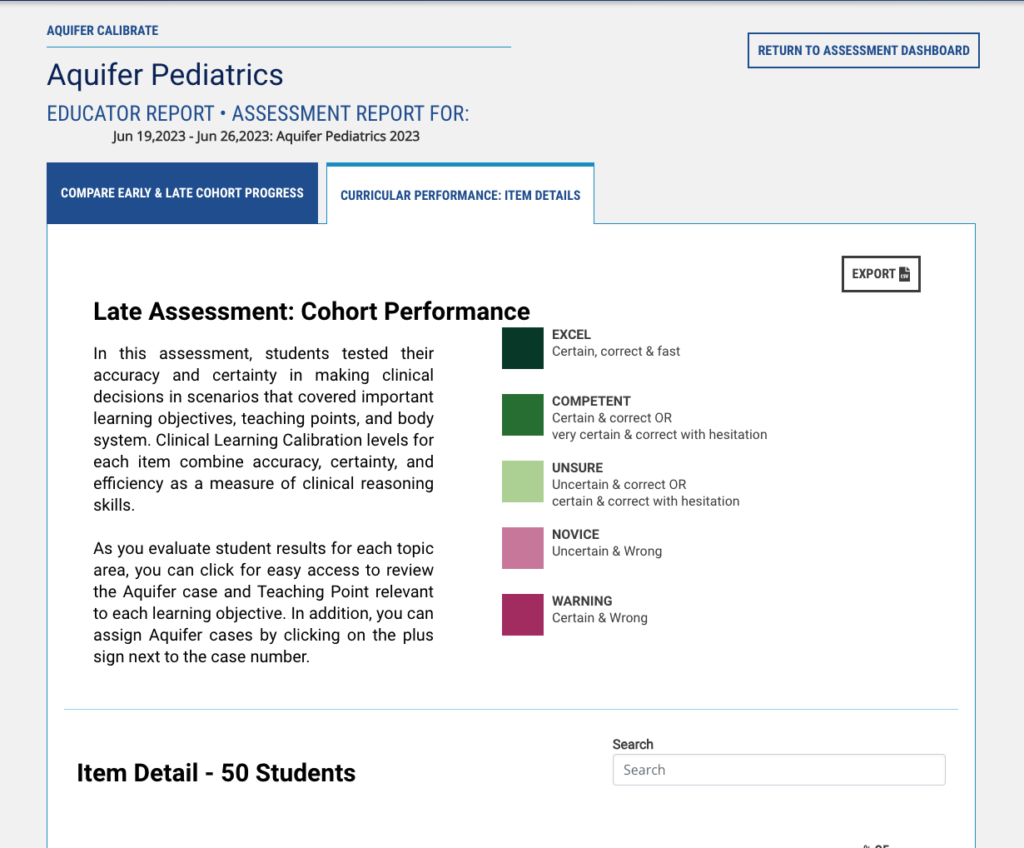
Students tested their accuracy and certainty in clinical decisions in scenarios covering important learning objectives, teaching points, and body systems. Clinical Learning Calibration levels for each item combine accuracy, certainty, and efficiency to measure clinical reasoning skills. This tab shows the Clinical Learning Calibration for the cohort.
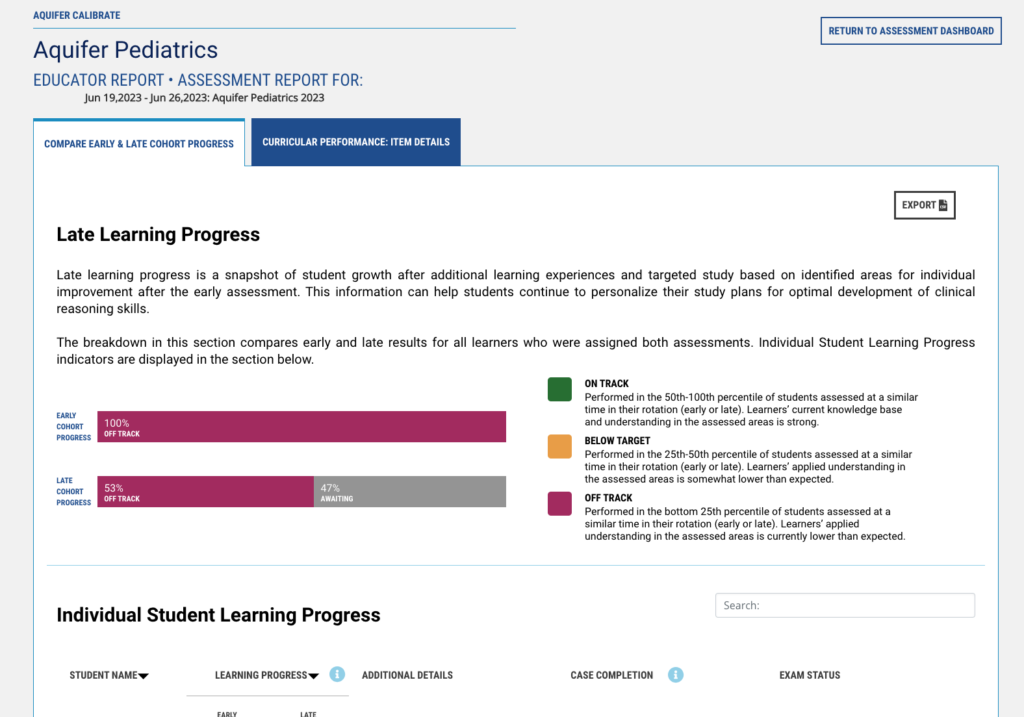
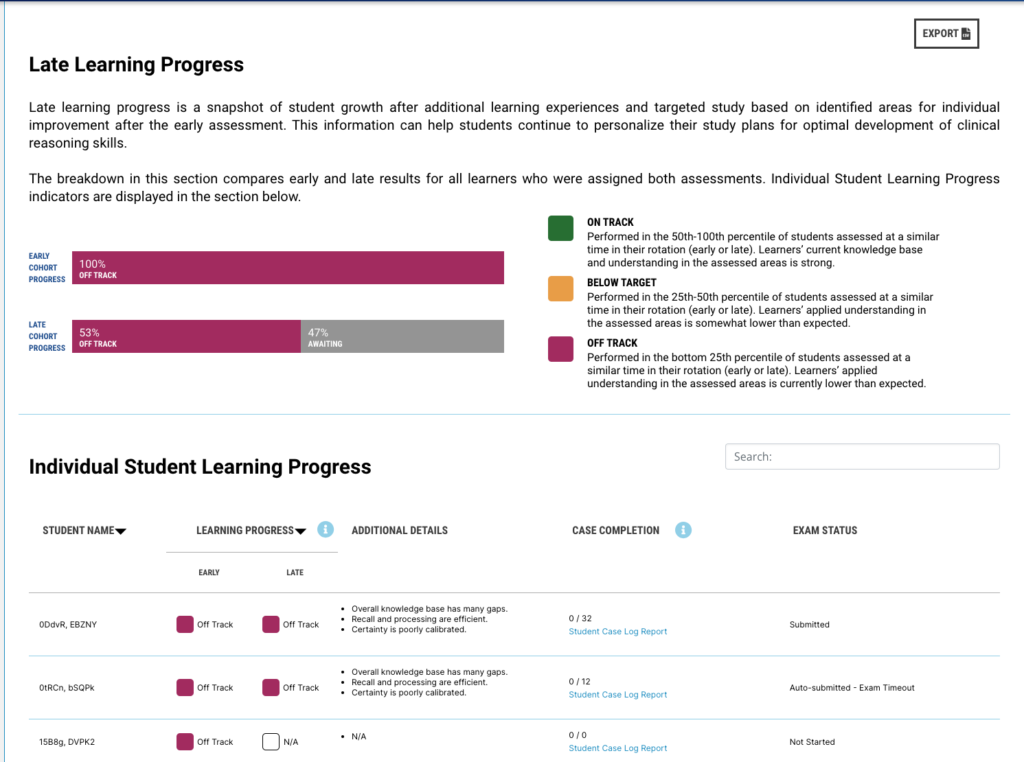
Compare Early and Late Cohort Progress
This tab compares early and late results for all learners assigned to both assessments. This information can help students continue personalizing their study plans for the optimal development of clinical reasoning skills.
The breakdown in this section compares early and late results for all learners who were assigned both assessments.
Curricular Performance: Item Details (late assessment)
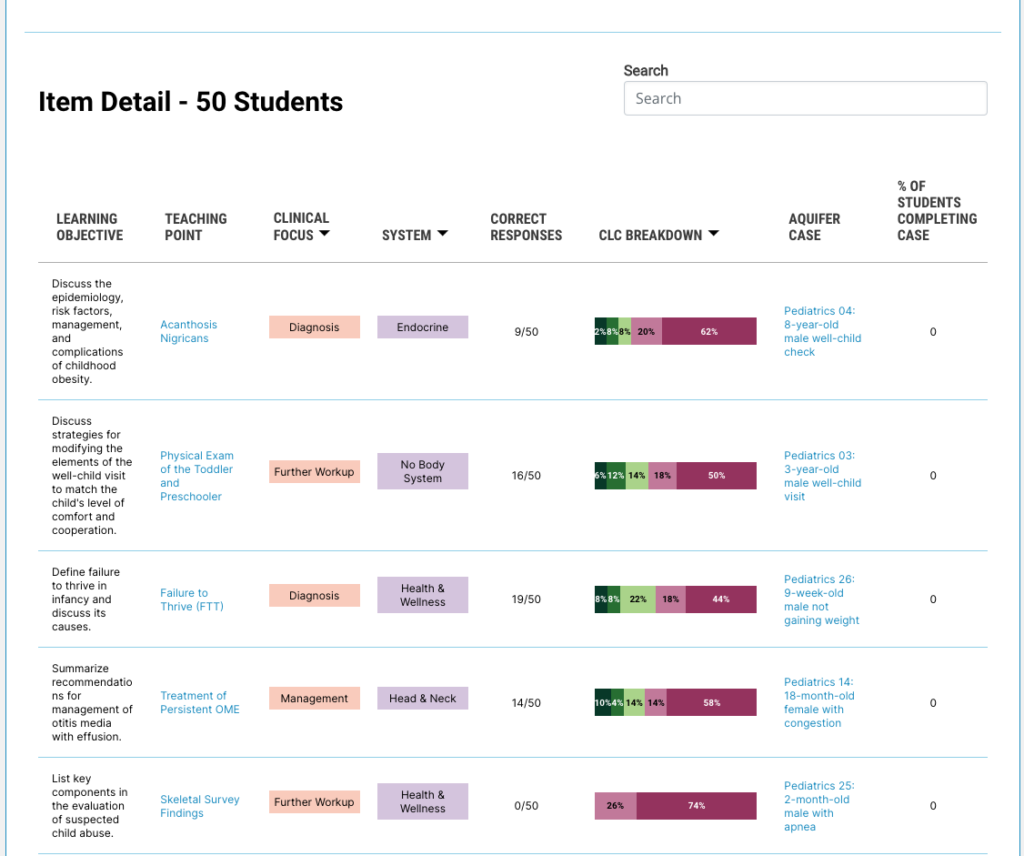
As with the early assessment, the Curricular Performance tab for the late assessment shows the students’ Clinical Learning Calibration levels for each item.
As you evaluate student results for each topic area, you can click for easy access to review the Aquifer case and Teaching Point relevant to each learning objective.
Learn more about Calibrate through this introductory video:
