
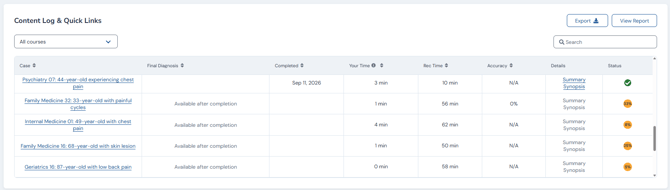
Full View from Student Dashboard
Clicking View Report will take you to your Student Report - a report view that provides an unfiltered look at all completed work and Calibrate assessments.
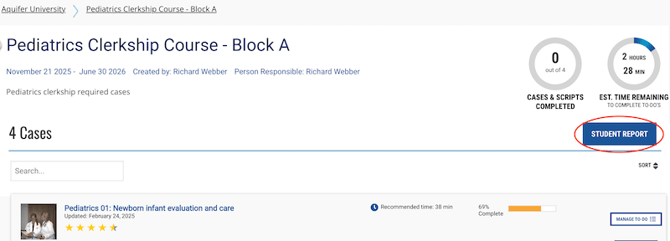
Course View from Course Details Page
This pathway will show the report filtered to display only the content included in your selected course. You can change the filter easily from this view.
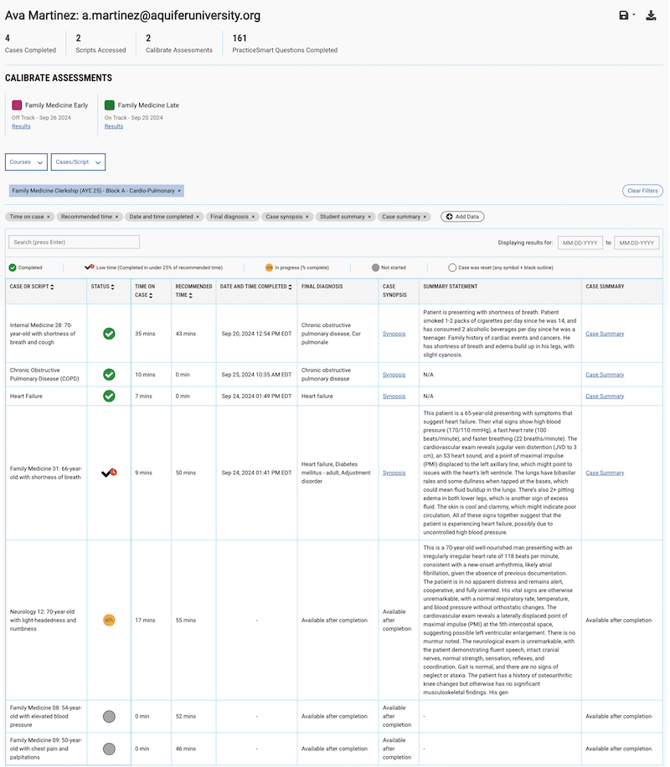
Inside Your Report
Your report shows all of the details on your work across the Aquifer platform, including:
-
Case completion
-
Time on case
-
Recommended time
-
Date and time completed
-
Summary statement (if applicable)
Using the Add Data option, you can add additional fields visible for completed cases only, including:
-
Final diagnosis
-
Case synopsis
-
Case Summary link
Below is a view of your student report. You can use your browser's zoom feature to fit more of the report view in your screen.
Filters
Students can filter by course or case to limit their view using the dropdown options located under the completion overview near the top left of the report.
Customize Data Views
Using the Add Data button, the student can add data tags like body system, patient age, clinical location, and more can be added to customize the report as needed. Unnecessary fields can be removed from the report view at any time.
Save
After customization, students can save their view as the default for their report by selecting the disk icon in the top right corner.
Export
The report can be easily exported to either a csv or excel file by selecting the arrow icon in the top right corner. The export contains the same information that exists in the report within the learning platform.