1 min read
Educators Share Aquifer User Stories
We’re excited to bring you our user story videos, filled with experiences from top health care educators using Aquifer. Find out how other programs...
On Sunday, Aquifer published new student dashboards that help users monitor their progress and organize study materials.
These improvements in user experience help students identify areas in need of review and encourage them to jump into study materials.
Students can see their learning progress across various data visualizations and quick stats, including total time on cases, total number of conditions covered, completed percent of their To Do List and more.
Once they take a Calibrate assessment or start PracticeSmart questions, visualizations of their accuracy and certainty populate, all of which hyperlink to more detailed reports.
The dashboards also host a content log, which lists all started cases and Integrated Illness Scripts the student has started.
Aquifer case names are generic to promote clinical decision making. Now with the Content Log, students can see the final diagnosis for cases they’ve completed. Identifying cases to review when targeting a specific issue just became much faster and easier.
The Content Log also includes:
Encourage your students to explore their dashboards and streamline their studies.
Looking for ways to leverage Aquifer? Schedule a meeting with our Adoption & Use Team.
Learn about the latest features and updates to our content and platform as they happen.
1 min read
We’re excited to bring you our user story videos, filled with experiences from top health care educators using Aquifer. Find out how other programs...
1 min read
Aquifer is pleased to announce the launch of several new features in Aqueduct to help administrators better manage all types of users. This major...
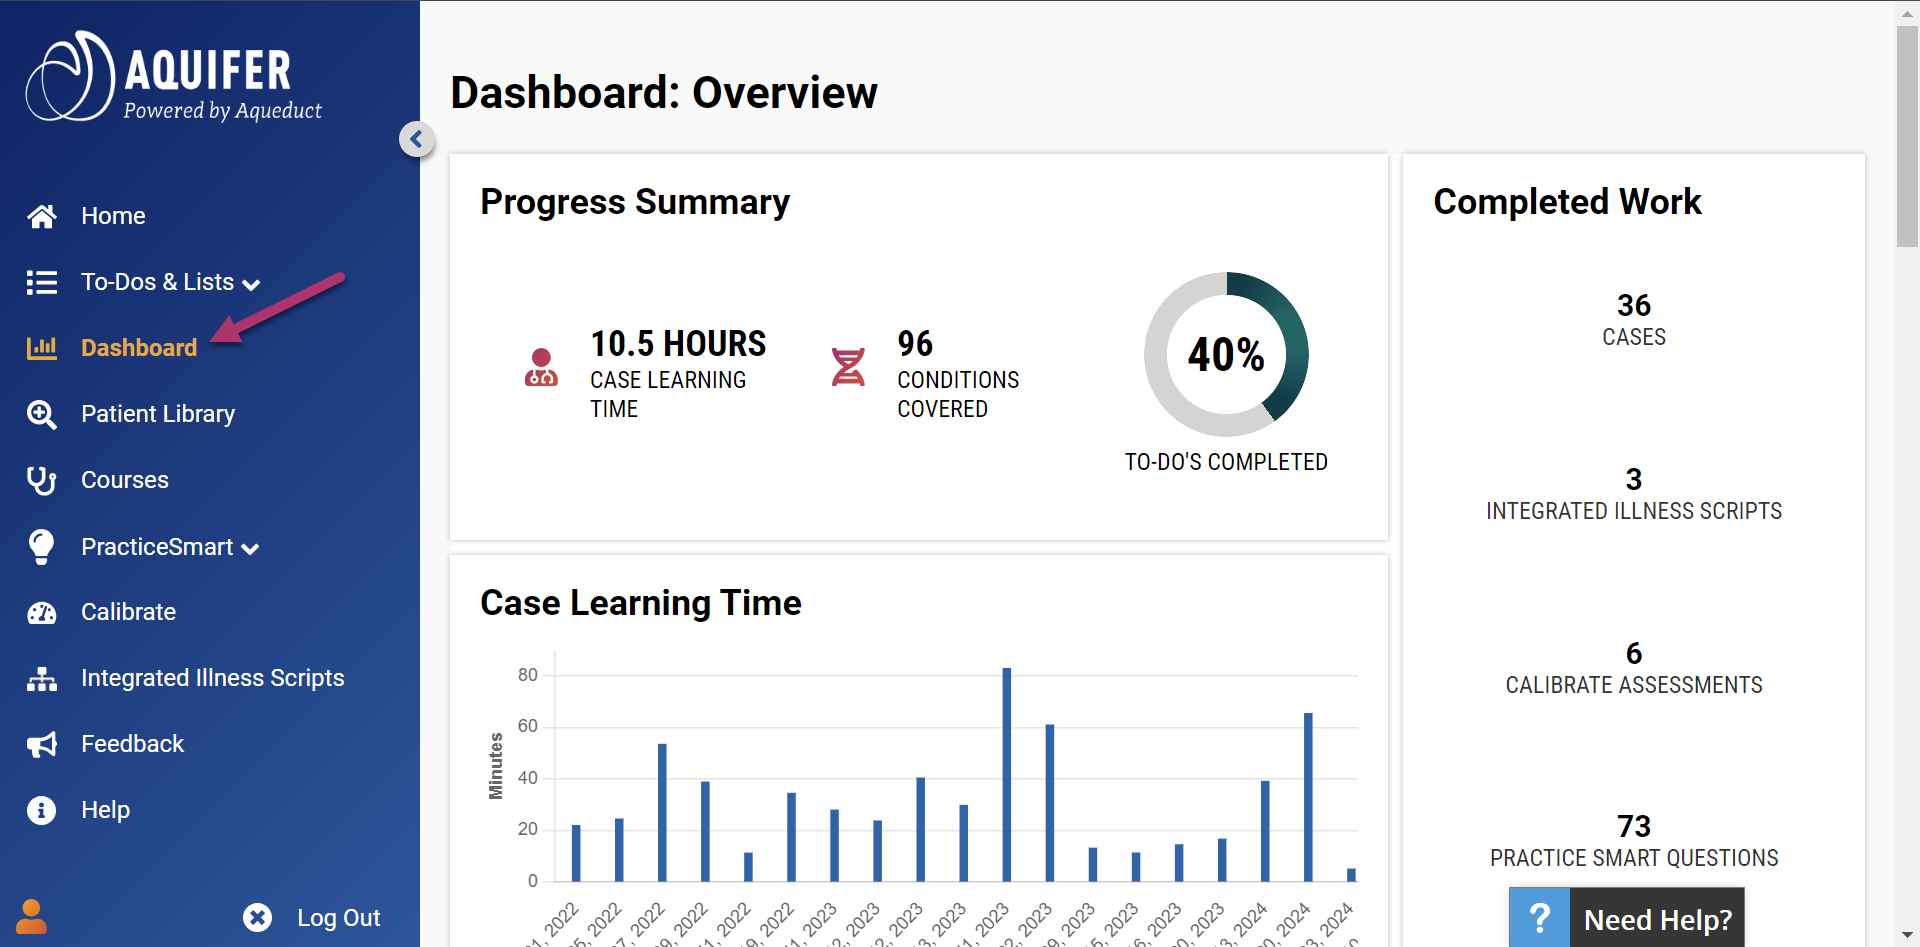
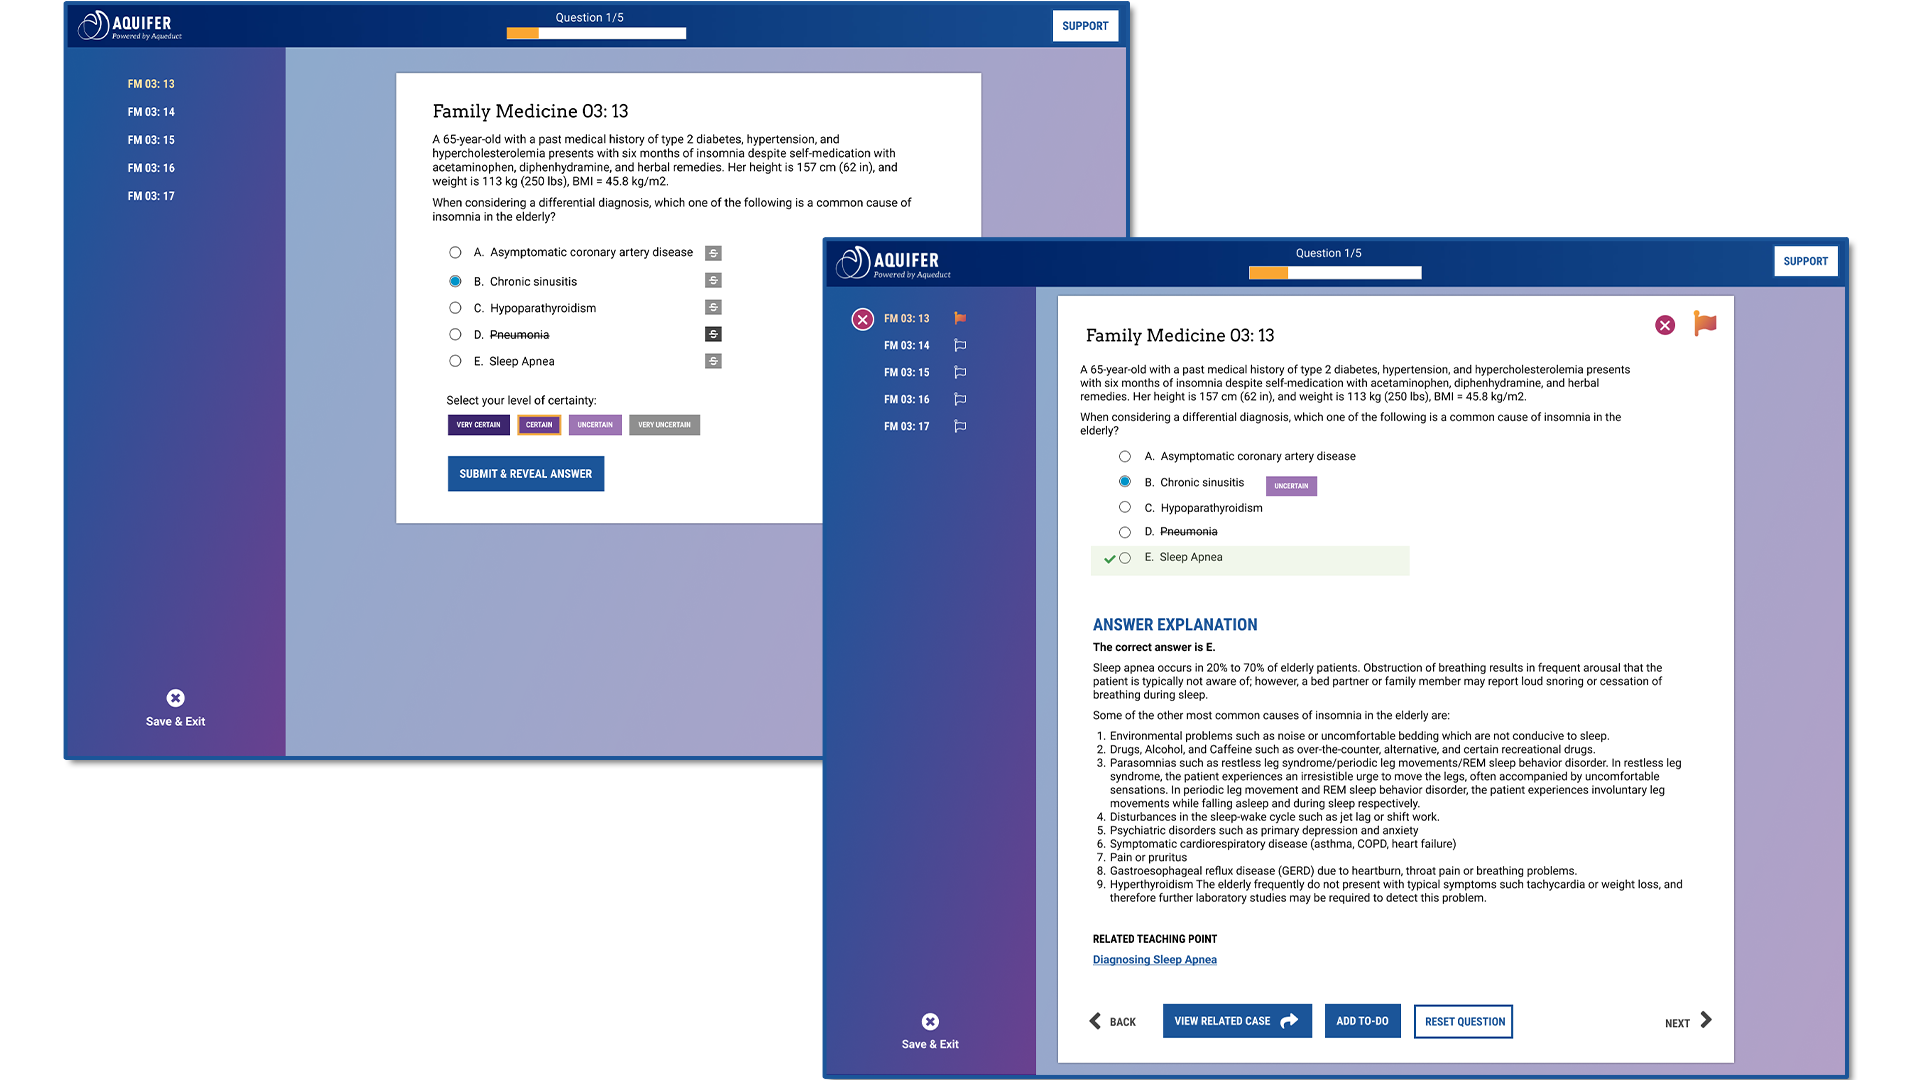
Aquifer rolled out a new study tool for health professions students on Sunday: PracticeSmart. PracticeSmart is much more than just another question...