On Sunday, Aquifer published new student dashboards that help users monitor their progress and organize study materials.
These improvements in user experience help students identify areas in need of review and encourage them to jump into study materials.
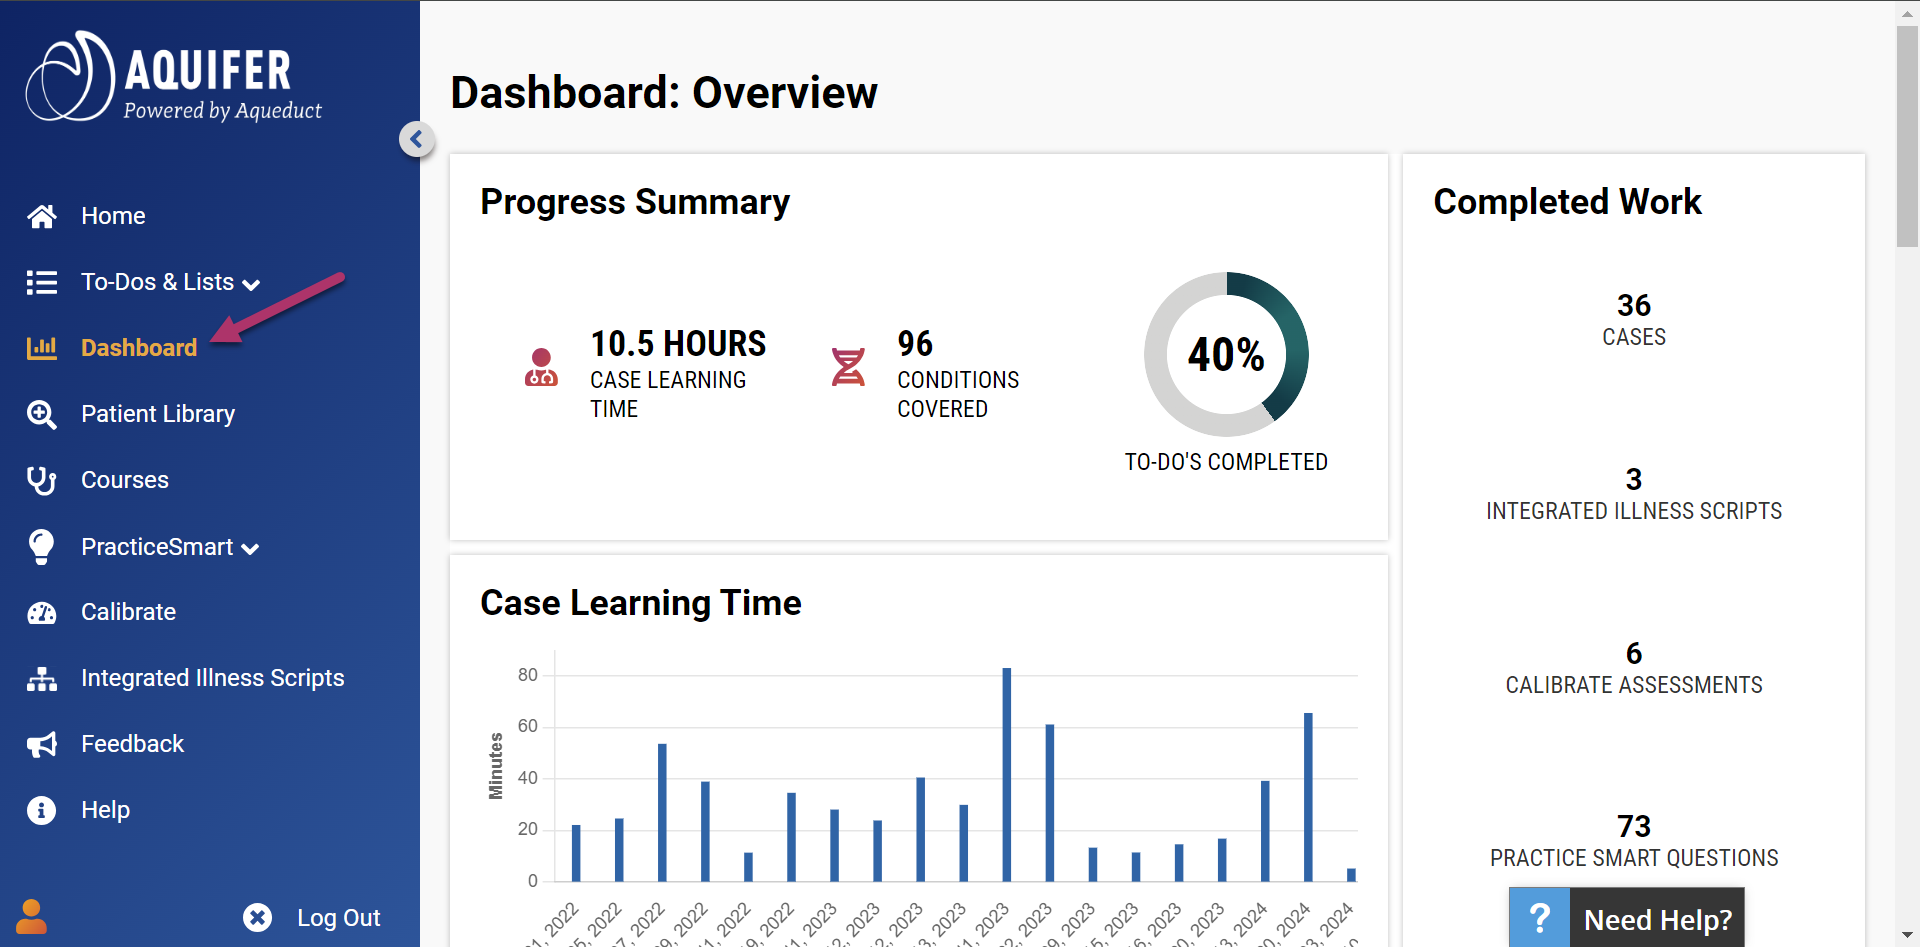
Students can see their learning progress across various data visualizations and quick stats, including total time on cases, total number of conditions covered, completed percent of their To Do List and more.
Once they take a Calibrate assessment or start PracticeSmart questions, visualizations of their accuracy and certainty populate, all of which hyperlink to more detailed reports.
The dashboards also host a content log, which lists all started cases and Integrated Illness Scripts the student has started.
Aquifer case names are generic to promote clinical decision making. Now with the Content Log, students can see the final diagnosis for cases they’ve completed. Identifying cases to review when targeting a specific issue just became much faster and easier.
The Content Log also includes:
- Case name with a convenient link to it
- Date completed, allowing students to locate content based on when they covered a topic in their courseload or clinical rotation
- Student time to complete vs. recommended time to complete to encourage thoughtfulness. If a student spends less than 25% of the recommended time in a case, a pink highlight alerts them.
- PracticeSmart statistics for the comprehension questions at the end of each case. Including the ratio completed, percent correct and a link to the quiz allow students to easily spot areas in need of review.
- Synopsis and Case Summary with direct links
- Percent of case completed
Encourage your students to explore their dashboards and streamline their studies.
Looking for ways to leverage Aquifer? Schedule a meeting with our Adoption & Use Team.