Transform your teaching with Aquifer’s new Educator Dashboards that make it easy to access data and get actionable insights.
Maximizing Your Dashboard Value
Identifying Learning Opportunities
- Time Analysis: Look for cases with consistently low completion times–these may indicate content that’s too easy for students or situations where students are rushing.
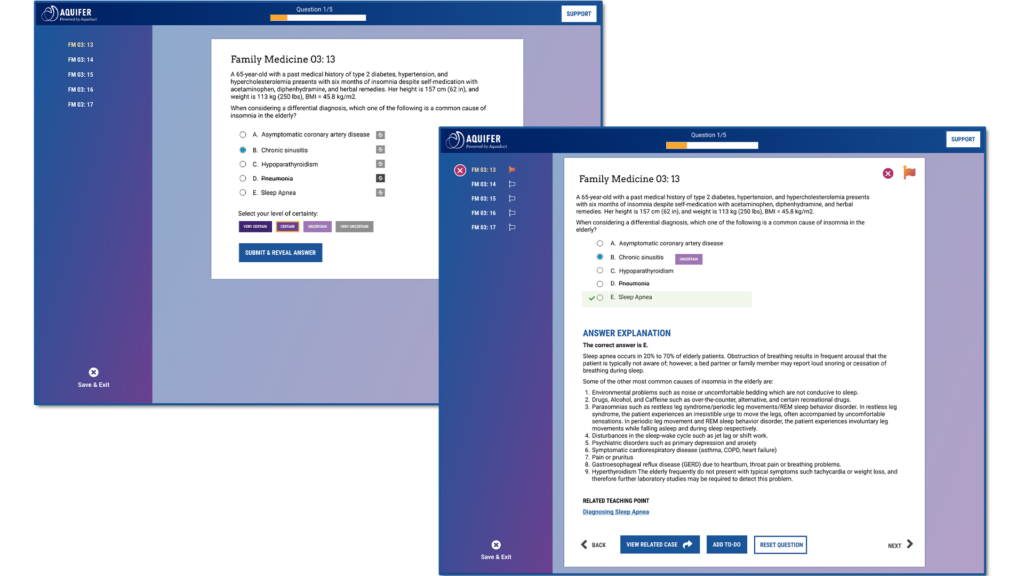
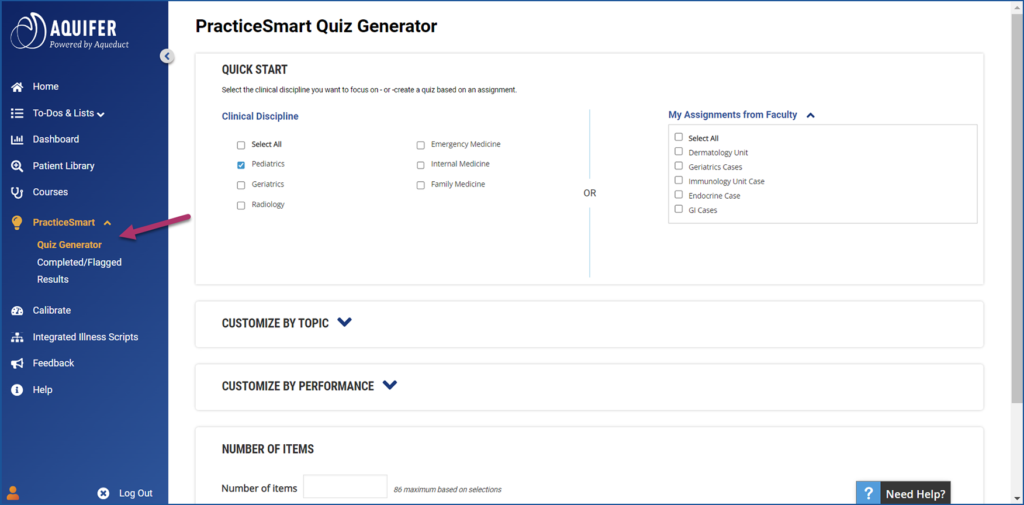
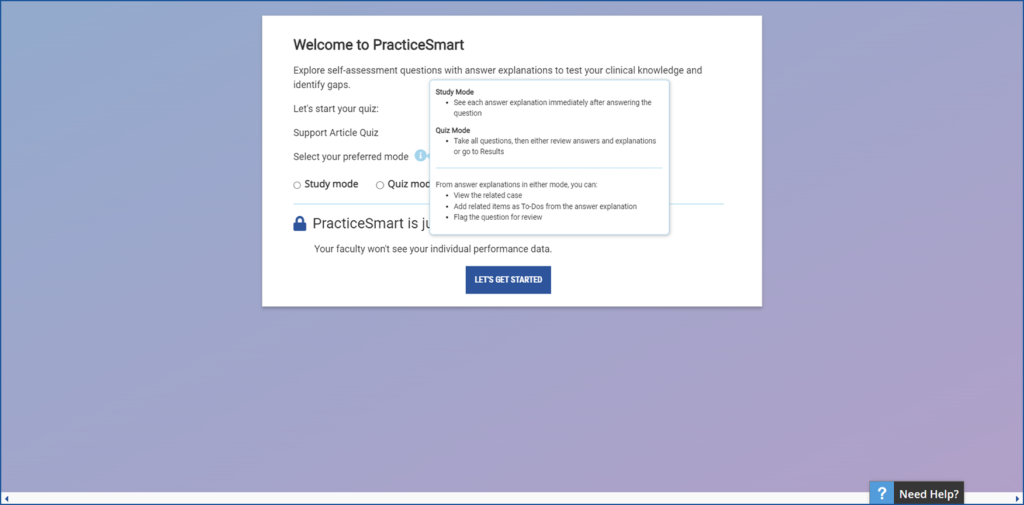
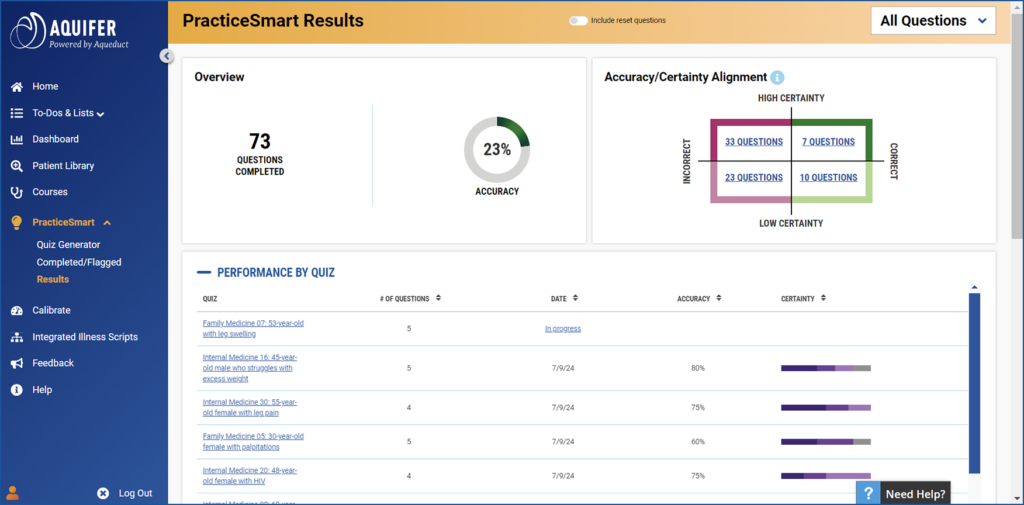
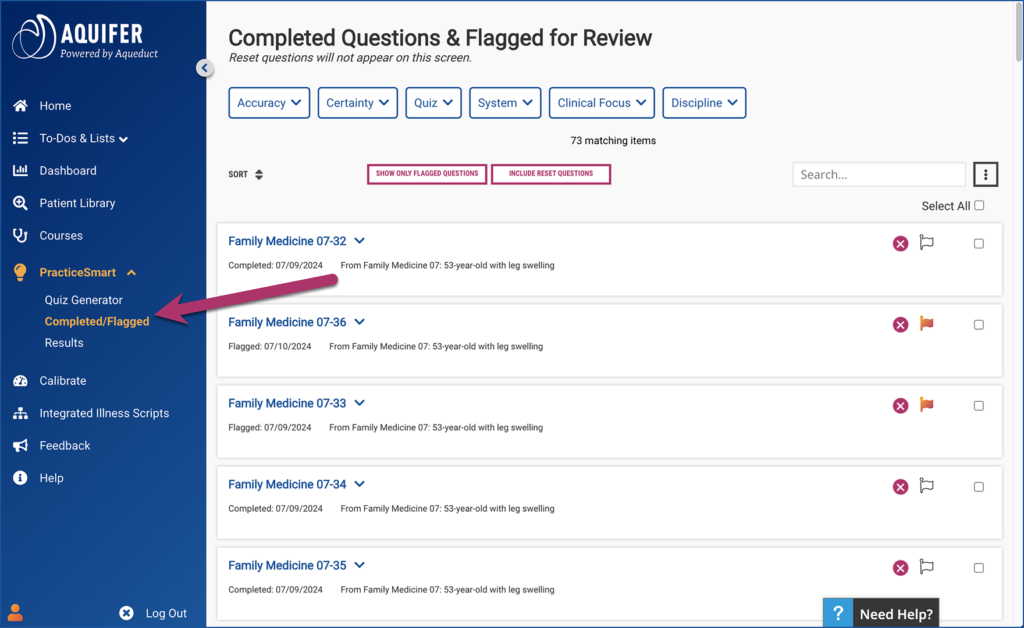
- Most Missed Question: Use PracticeSmart data to identify concepts that need reinforcement.
- Completion Patterns: Monitor which cases have the highest and lowest completion rates.
Course Management Insights
- Content Coverage: Use the Conditions Covered export to ensure comprehensive curriculum coverage.
- Student Engagement: Track overall activity levels to see what content has higher or lower levels of student engagement.
- Performance Trends: Monitor changes over time by adjusting your date range.
Making Data-Driven Decisions
- Curriculum Adjustments: Use completion time data to identify potential adjustments to case assignments.
- Resource Allocation: Focus efforts on areas where students show the most difficulty.
Getting Started
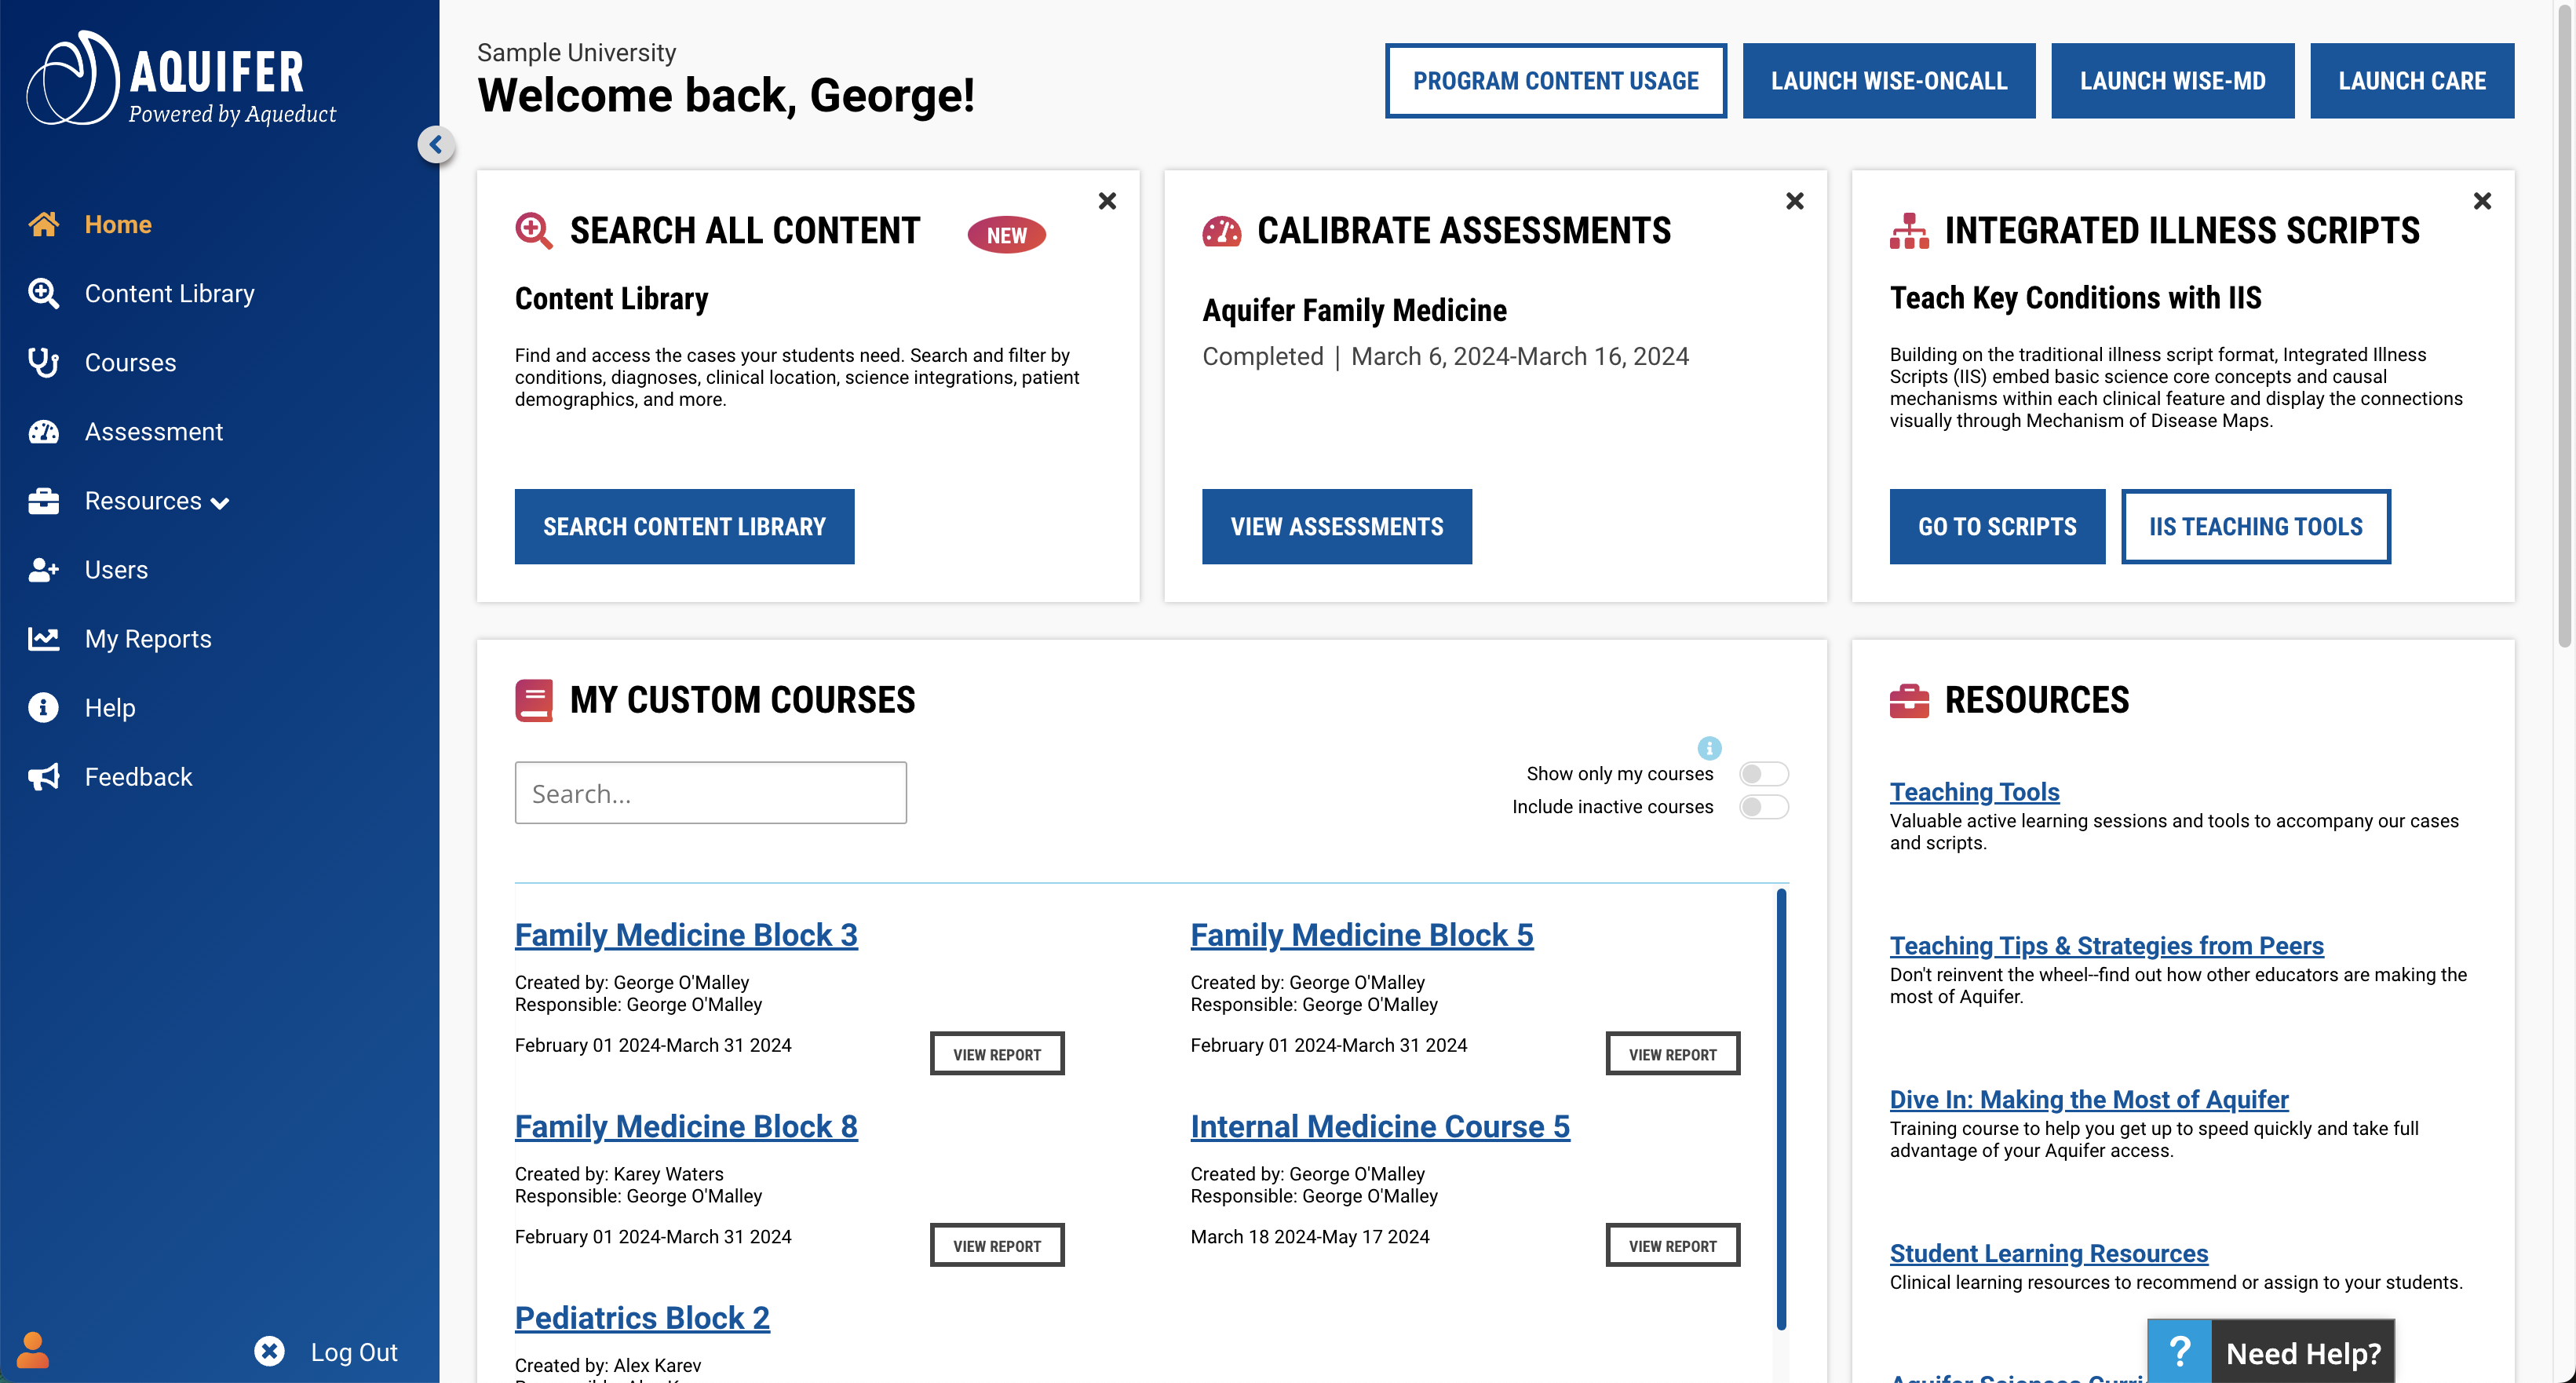
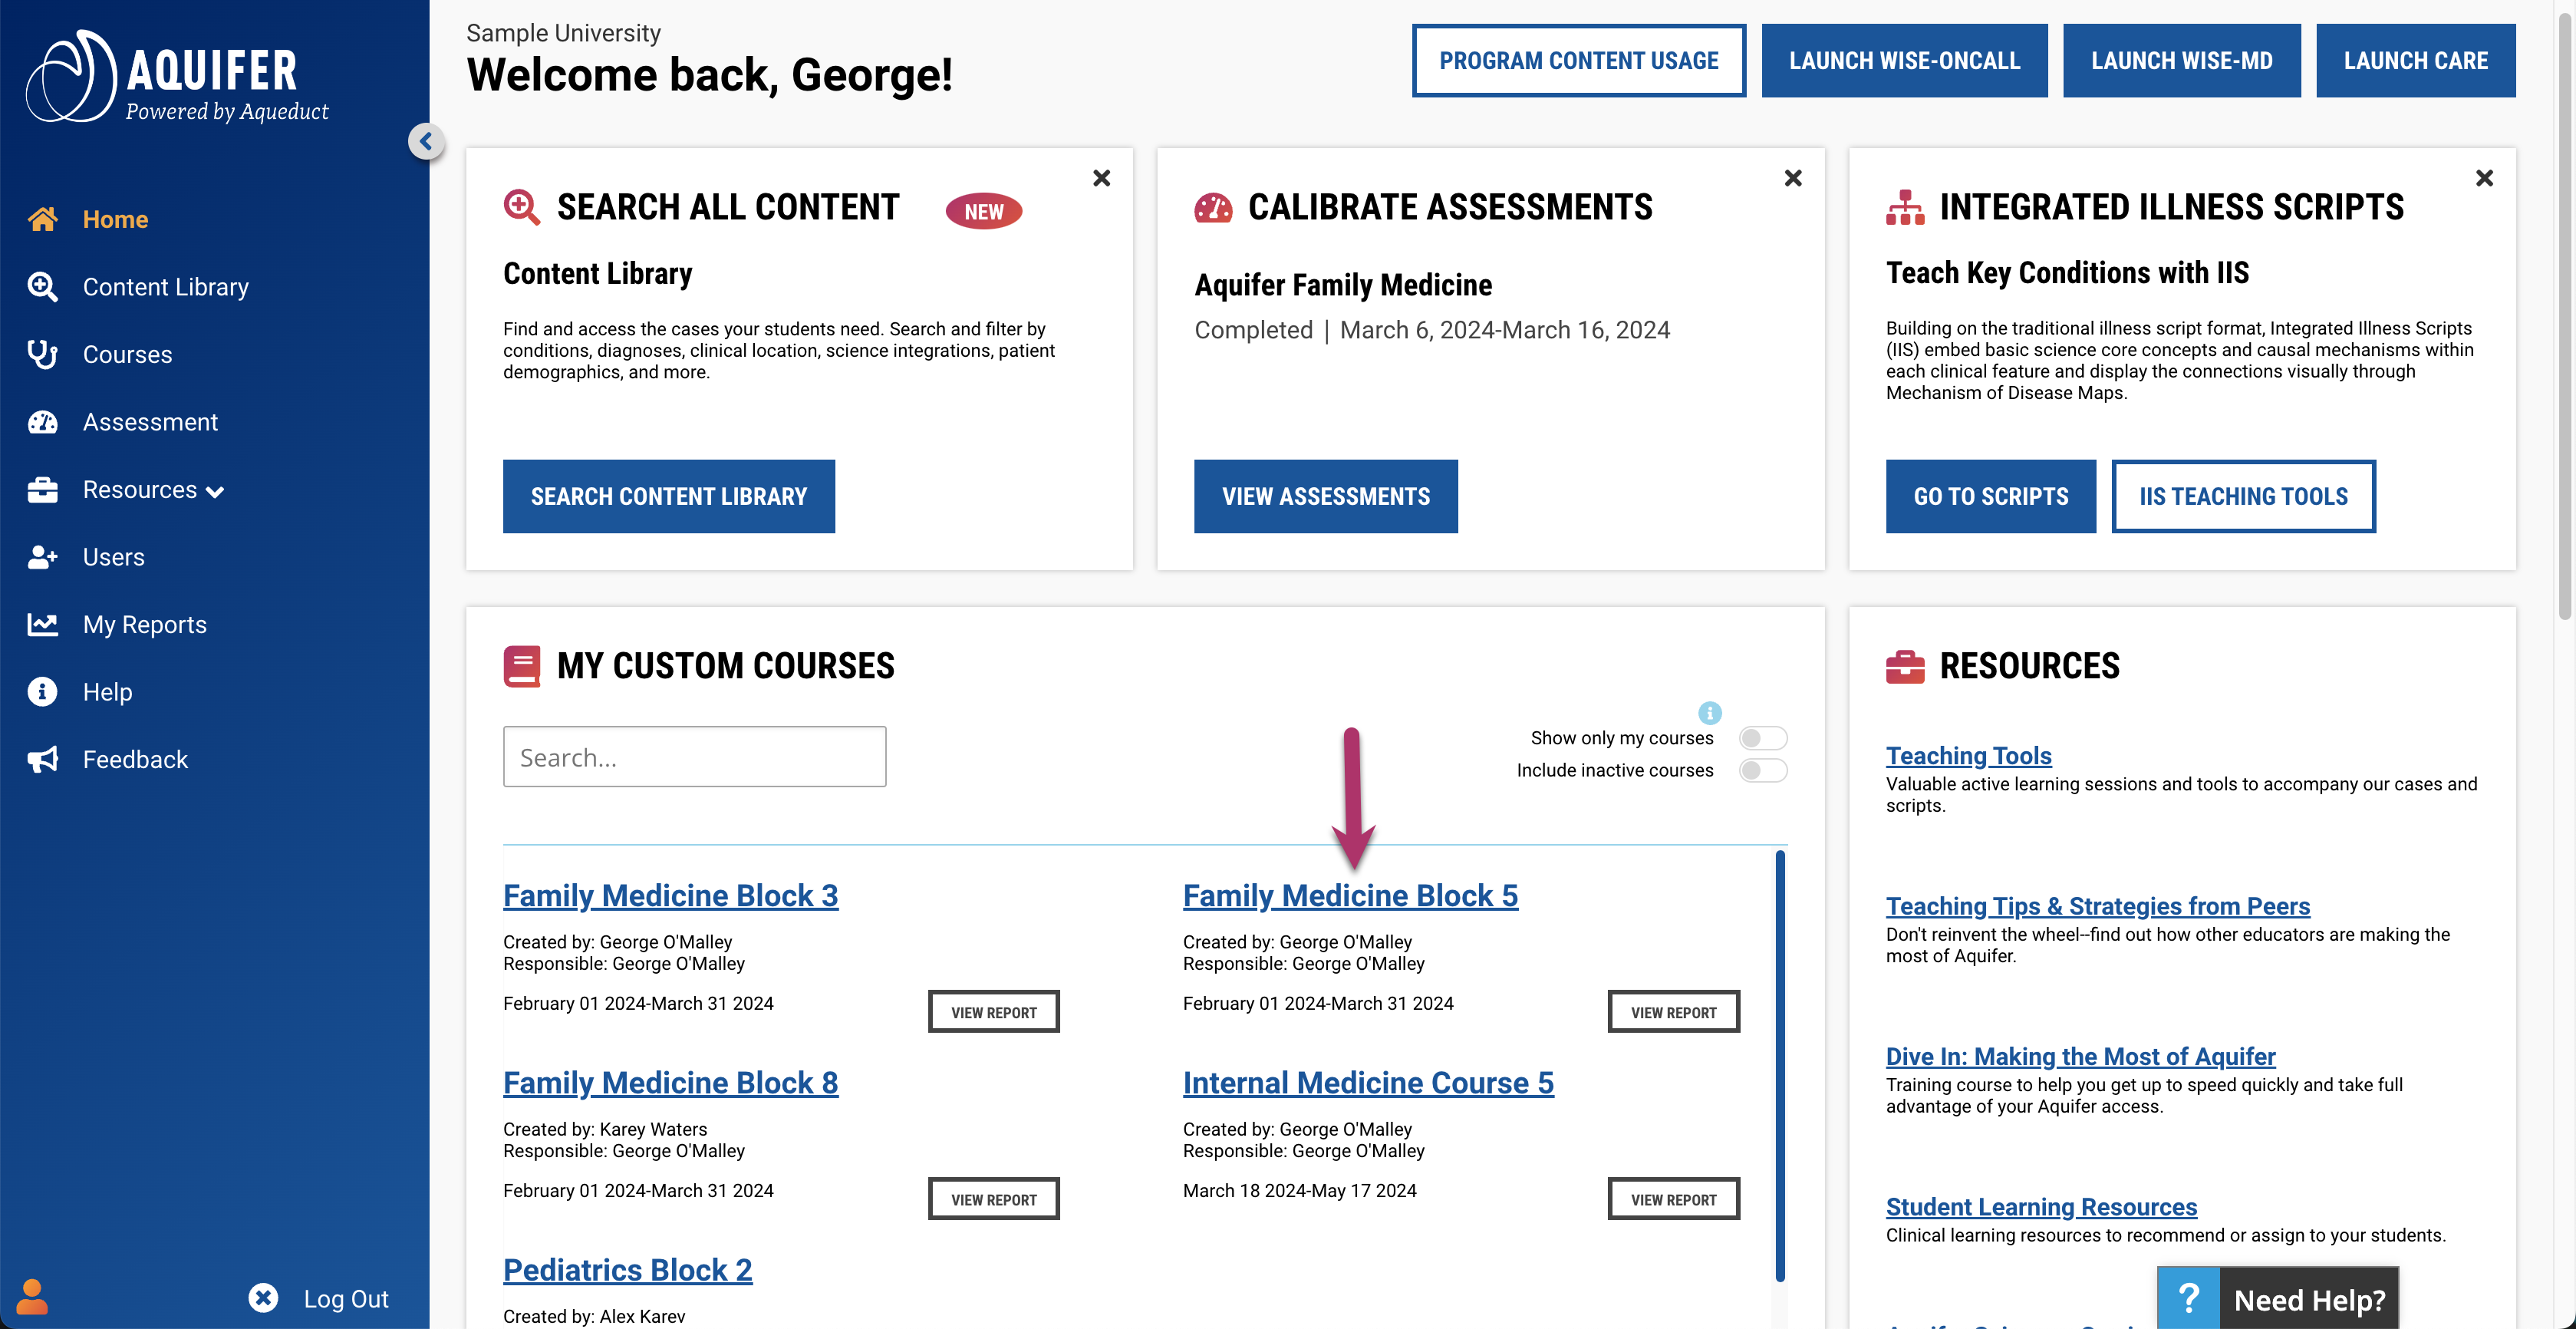
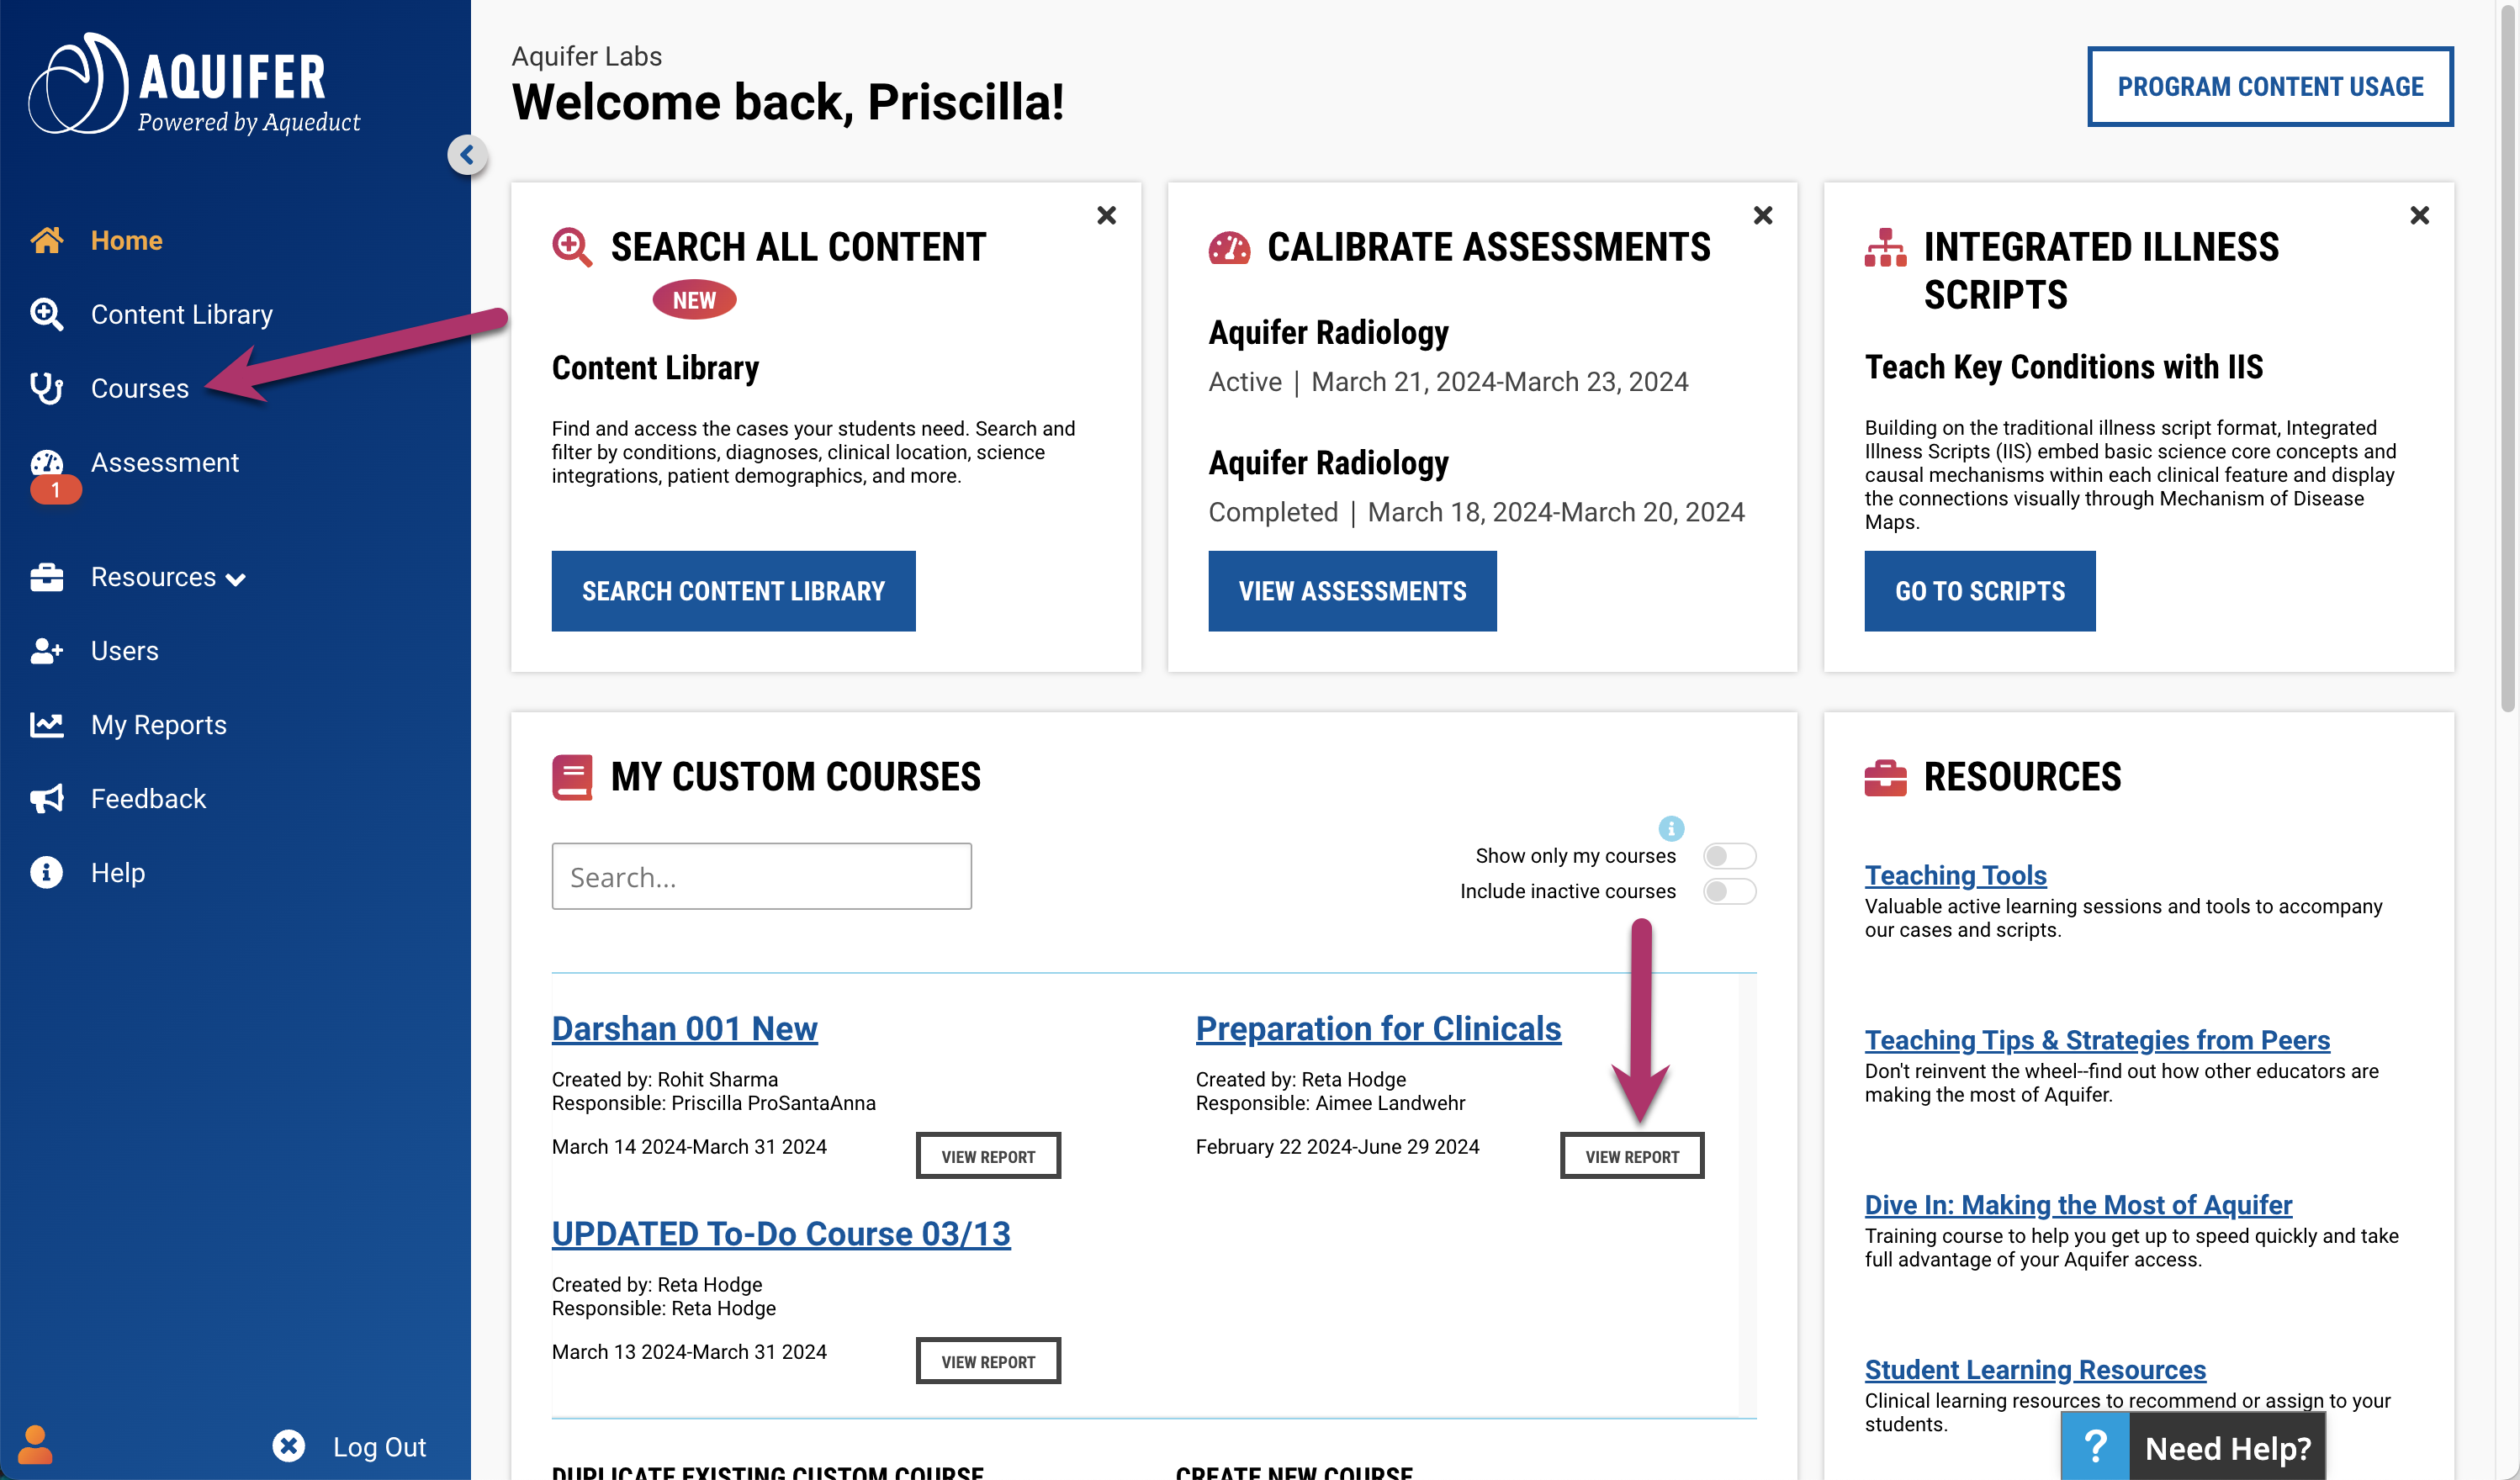
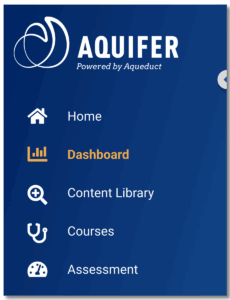
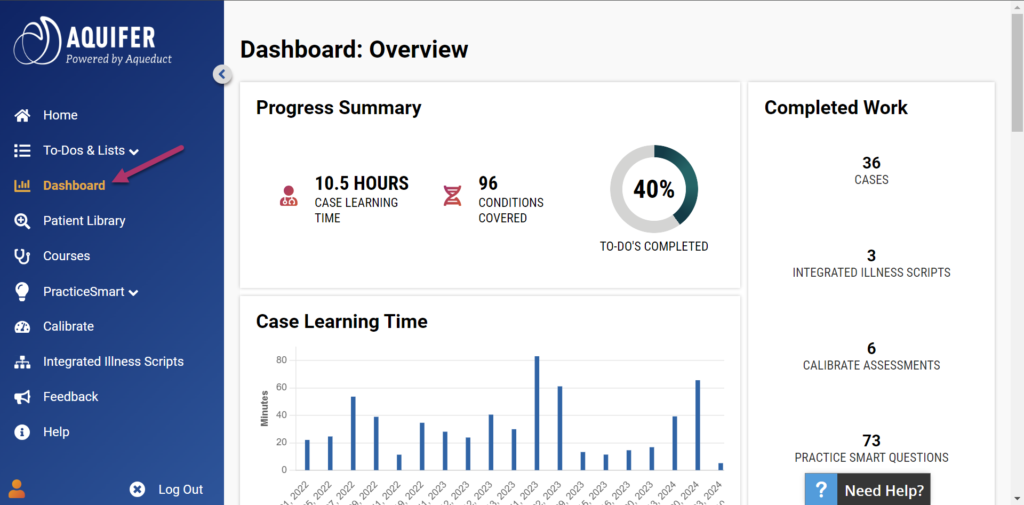
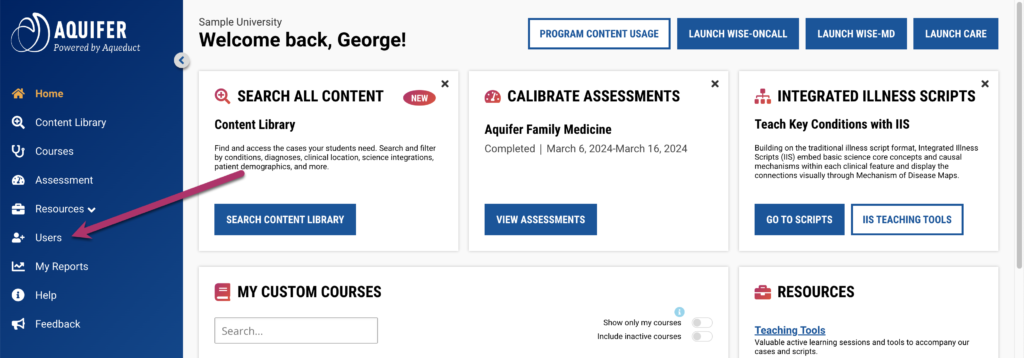
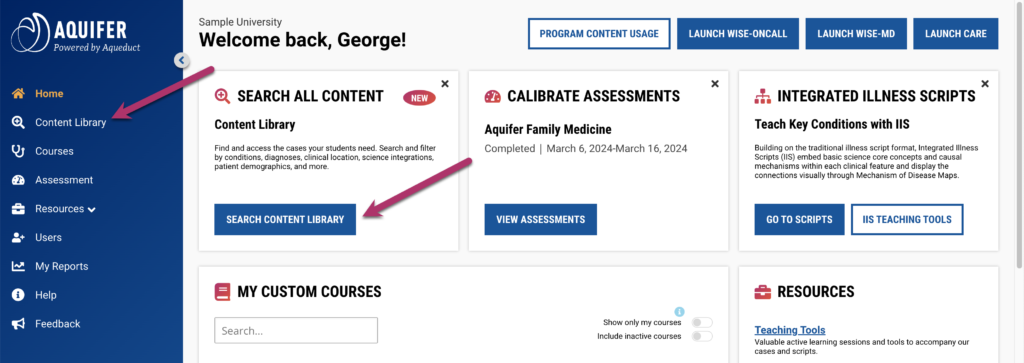
Access Your Dashboard: Click the bar chart icon in the left sidebar navigation.
Understand Your View: Your dashboard displays data based on your role and related permissions.
- Course Access: When you see “All Courses” in dropdown menus, this includes only the courses you have permission to access.
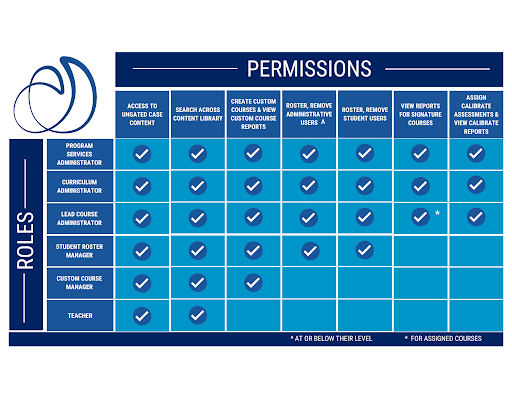
- Calibrate Data: Access to Calibrate assessment data is restricted to Curriculum Administrators (CAs) and Program Services Administrators (PSAs), plus Lead Course Administrators (LCAs) for their assigned courses.
- Report Access: All reports accessible from your dashboard respect the same permission boundaries.
Setting Up Your Dashboard
Use the controls at the top of your dashboard to focus your data and analysis. Take action to see refreshed real-time data.
Date Range
- Default: Date range defaults from July 1st of current academic year to today.
- Customize: Edit start/end dates independently–with changes applying to all cards.
- Reset: Click “Reset Dates” to return to default range.

Date selections persist across sessions and carry over when you open detailed reports.
Data Updates
Dashboard data updates upon taking any action, such as refreshing the page, selecting a different course from the course dropdown menu, or navigating to or back to the page from another page.
Dashboard Cards
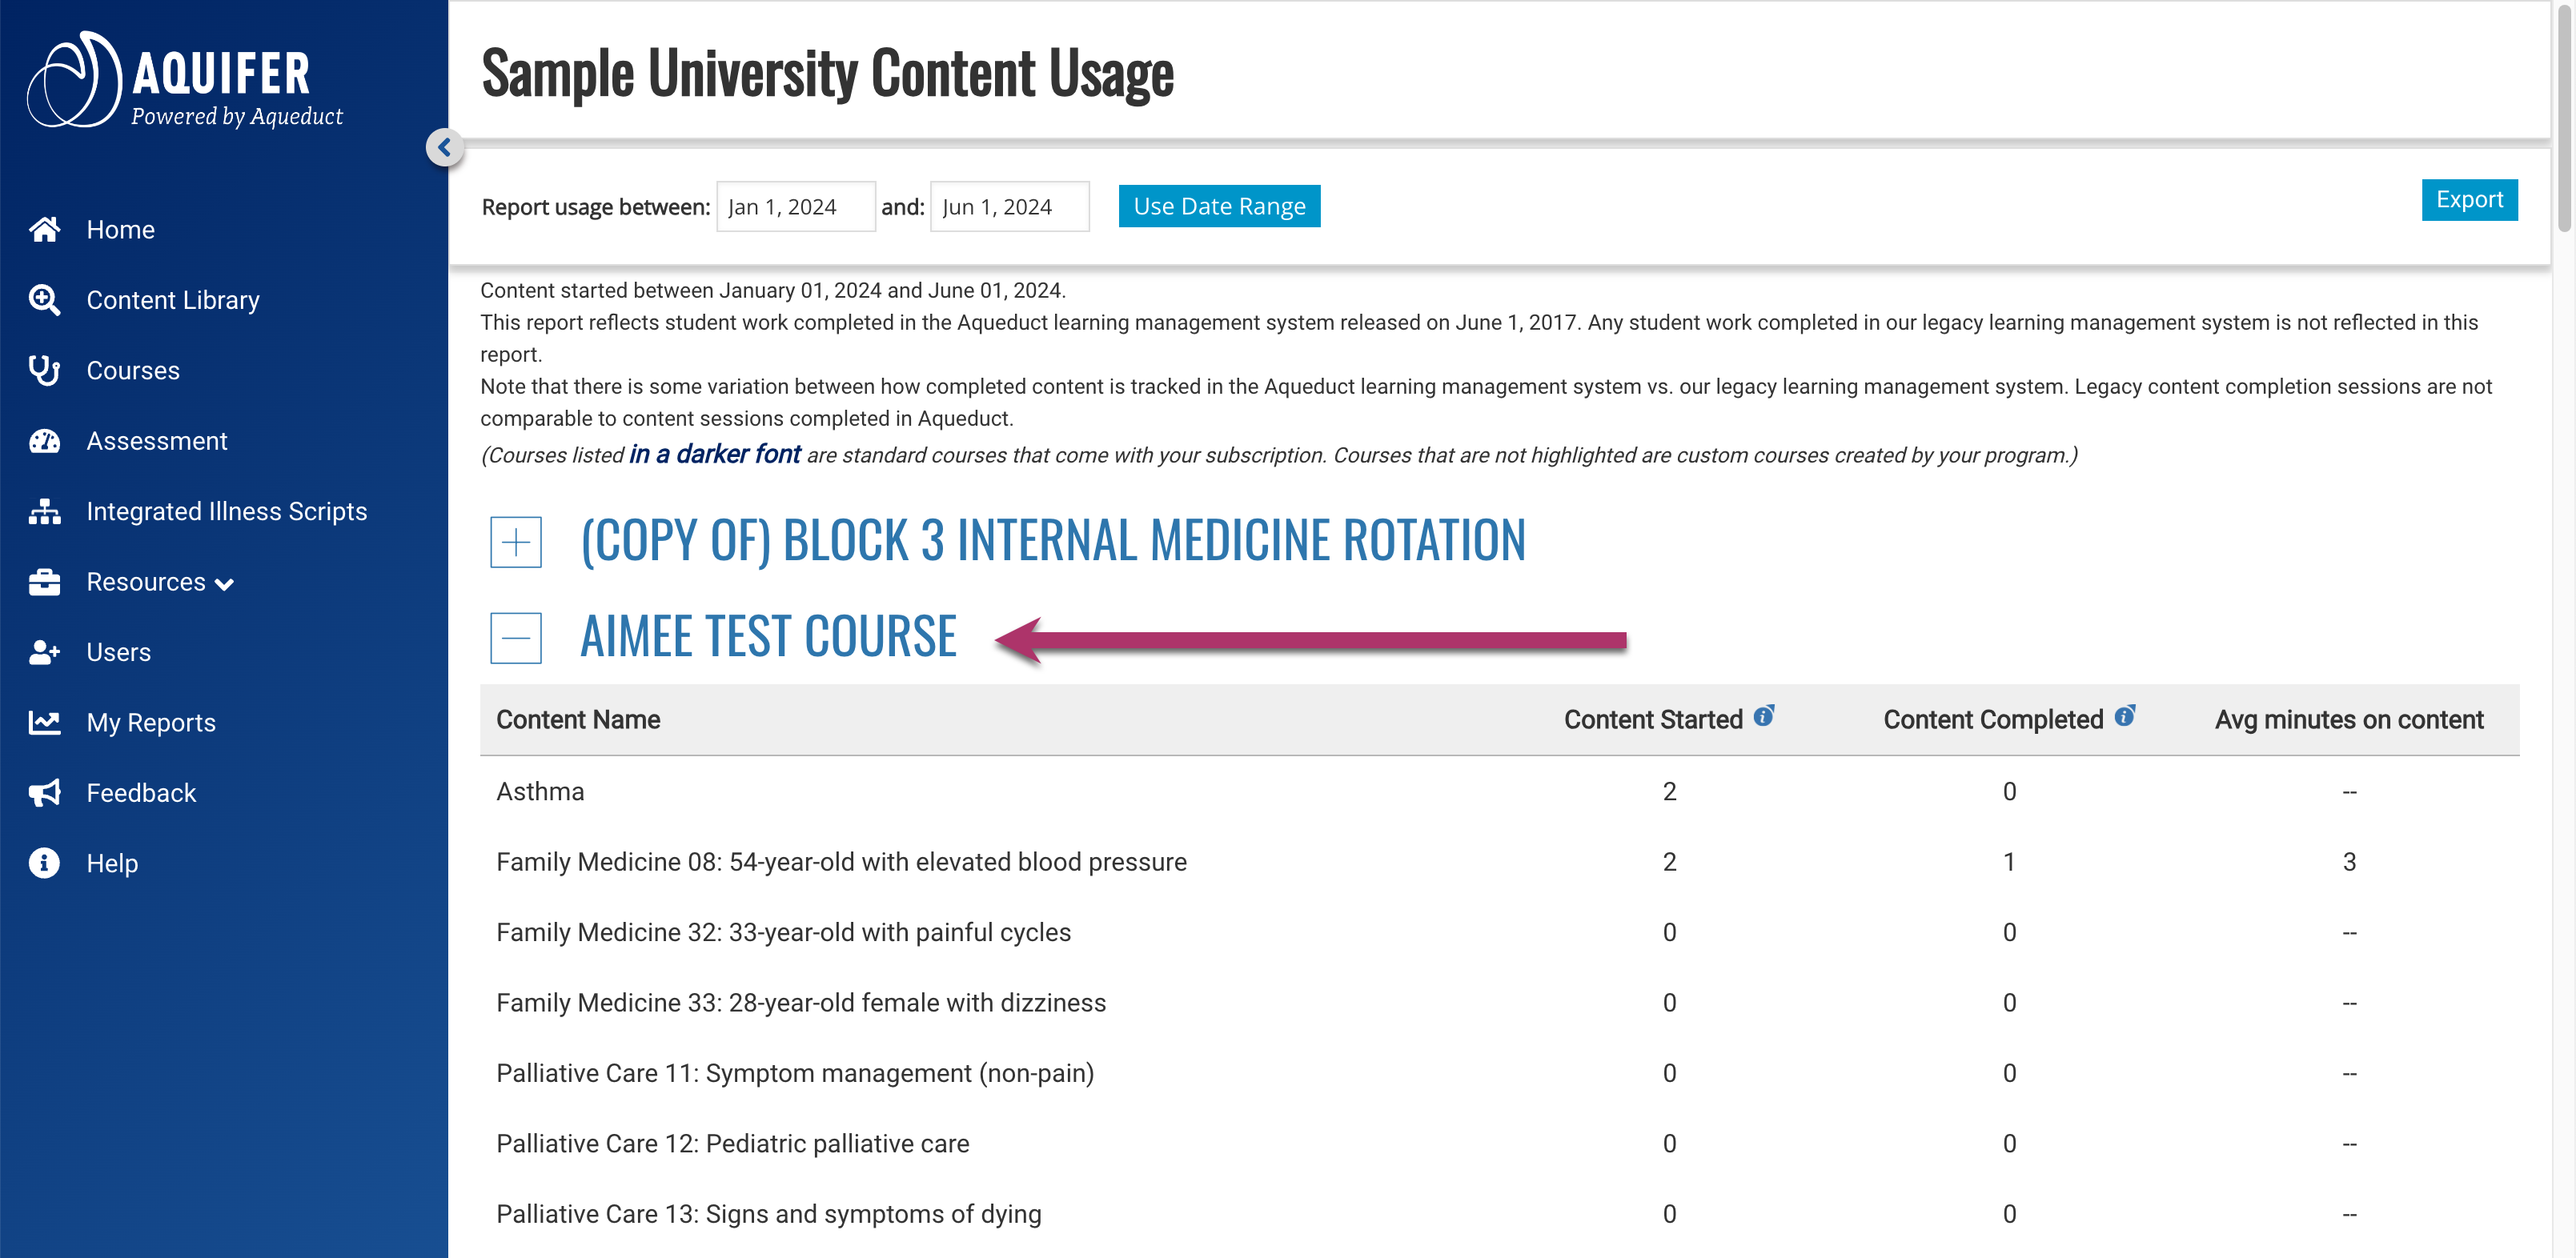
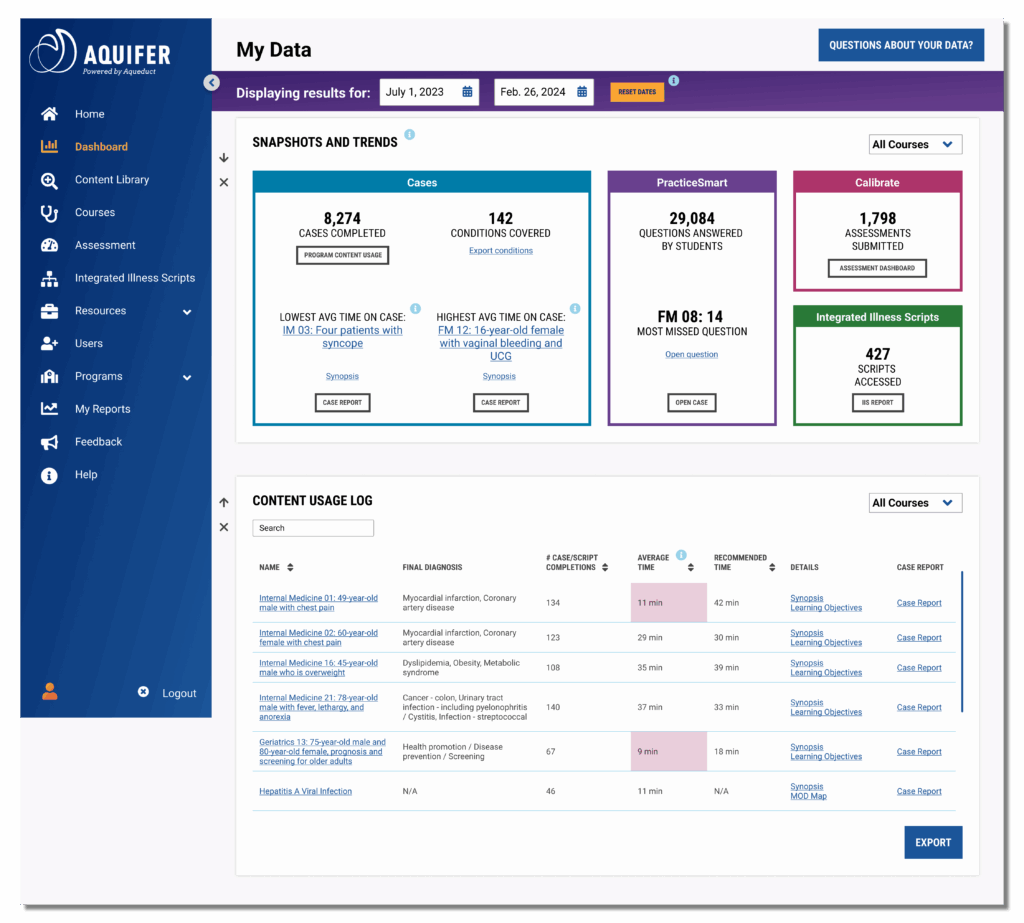
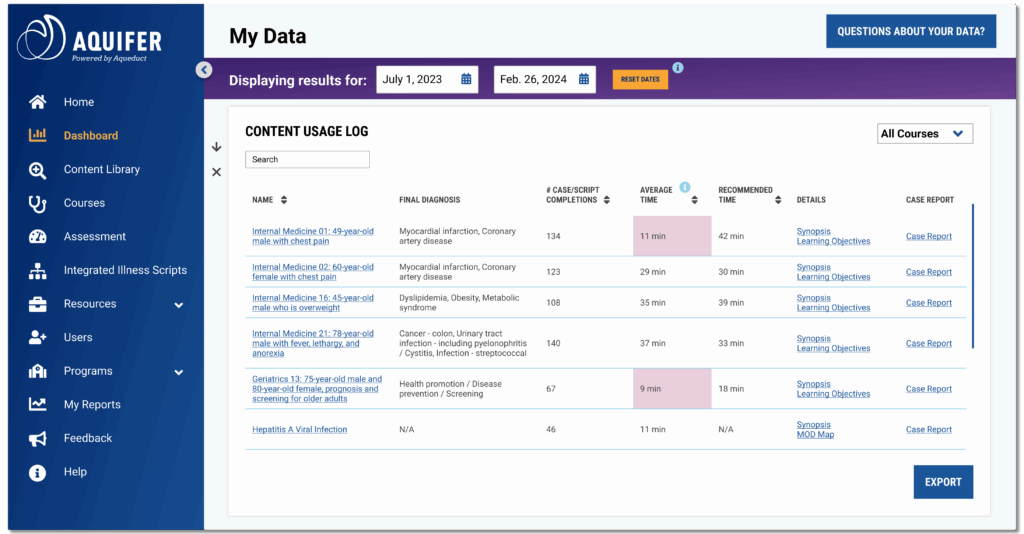
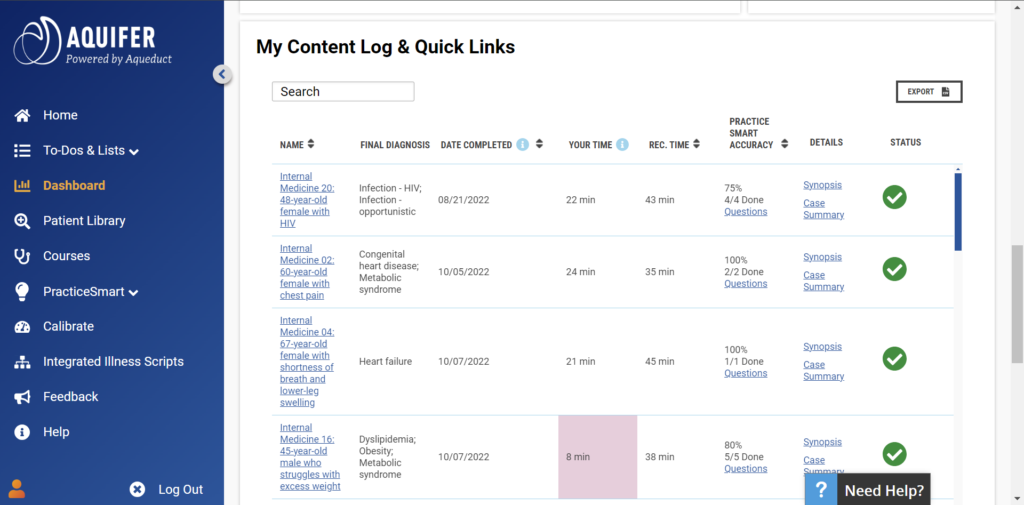
Content Usage Log – AVAILABLE NOW
This card presents a detailed view of student engagement with course materials.
Key Features
- Search: Find content by case titles, diagnoses, learning objectives, or case synopses.
- Filter: View data for all courses or drill down to specific ones.
- Engagement Analysis: Compare actual time spent against recommended time.
- Pink Alert: This overlay shows up on cases if the average time is less than 25% of recommended time, and may indicate rushing/low engagement.
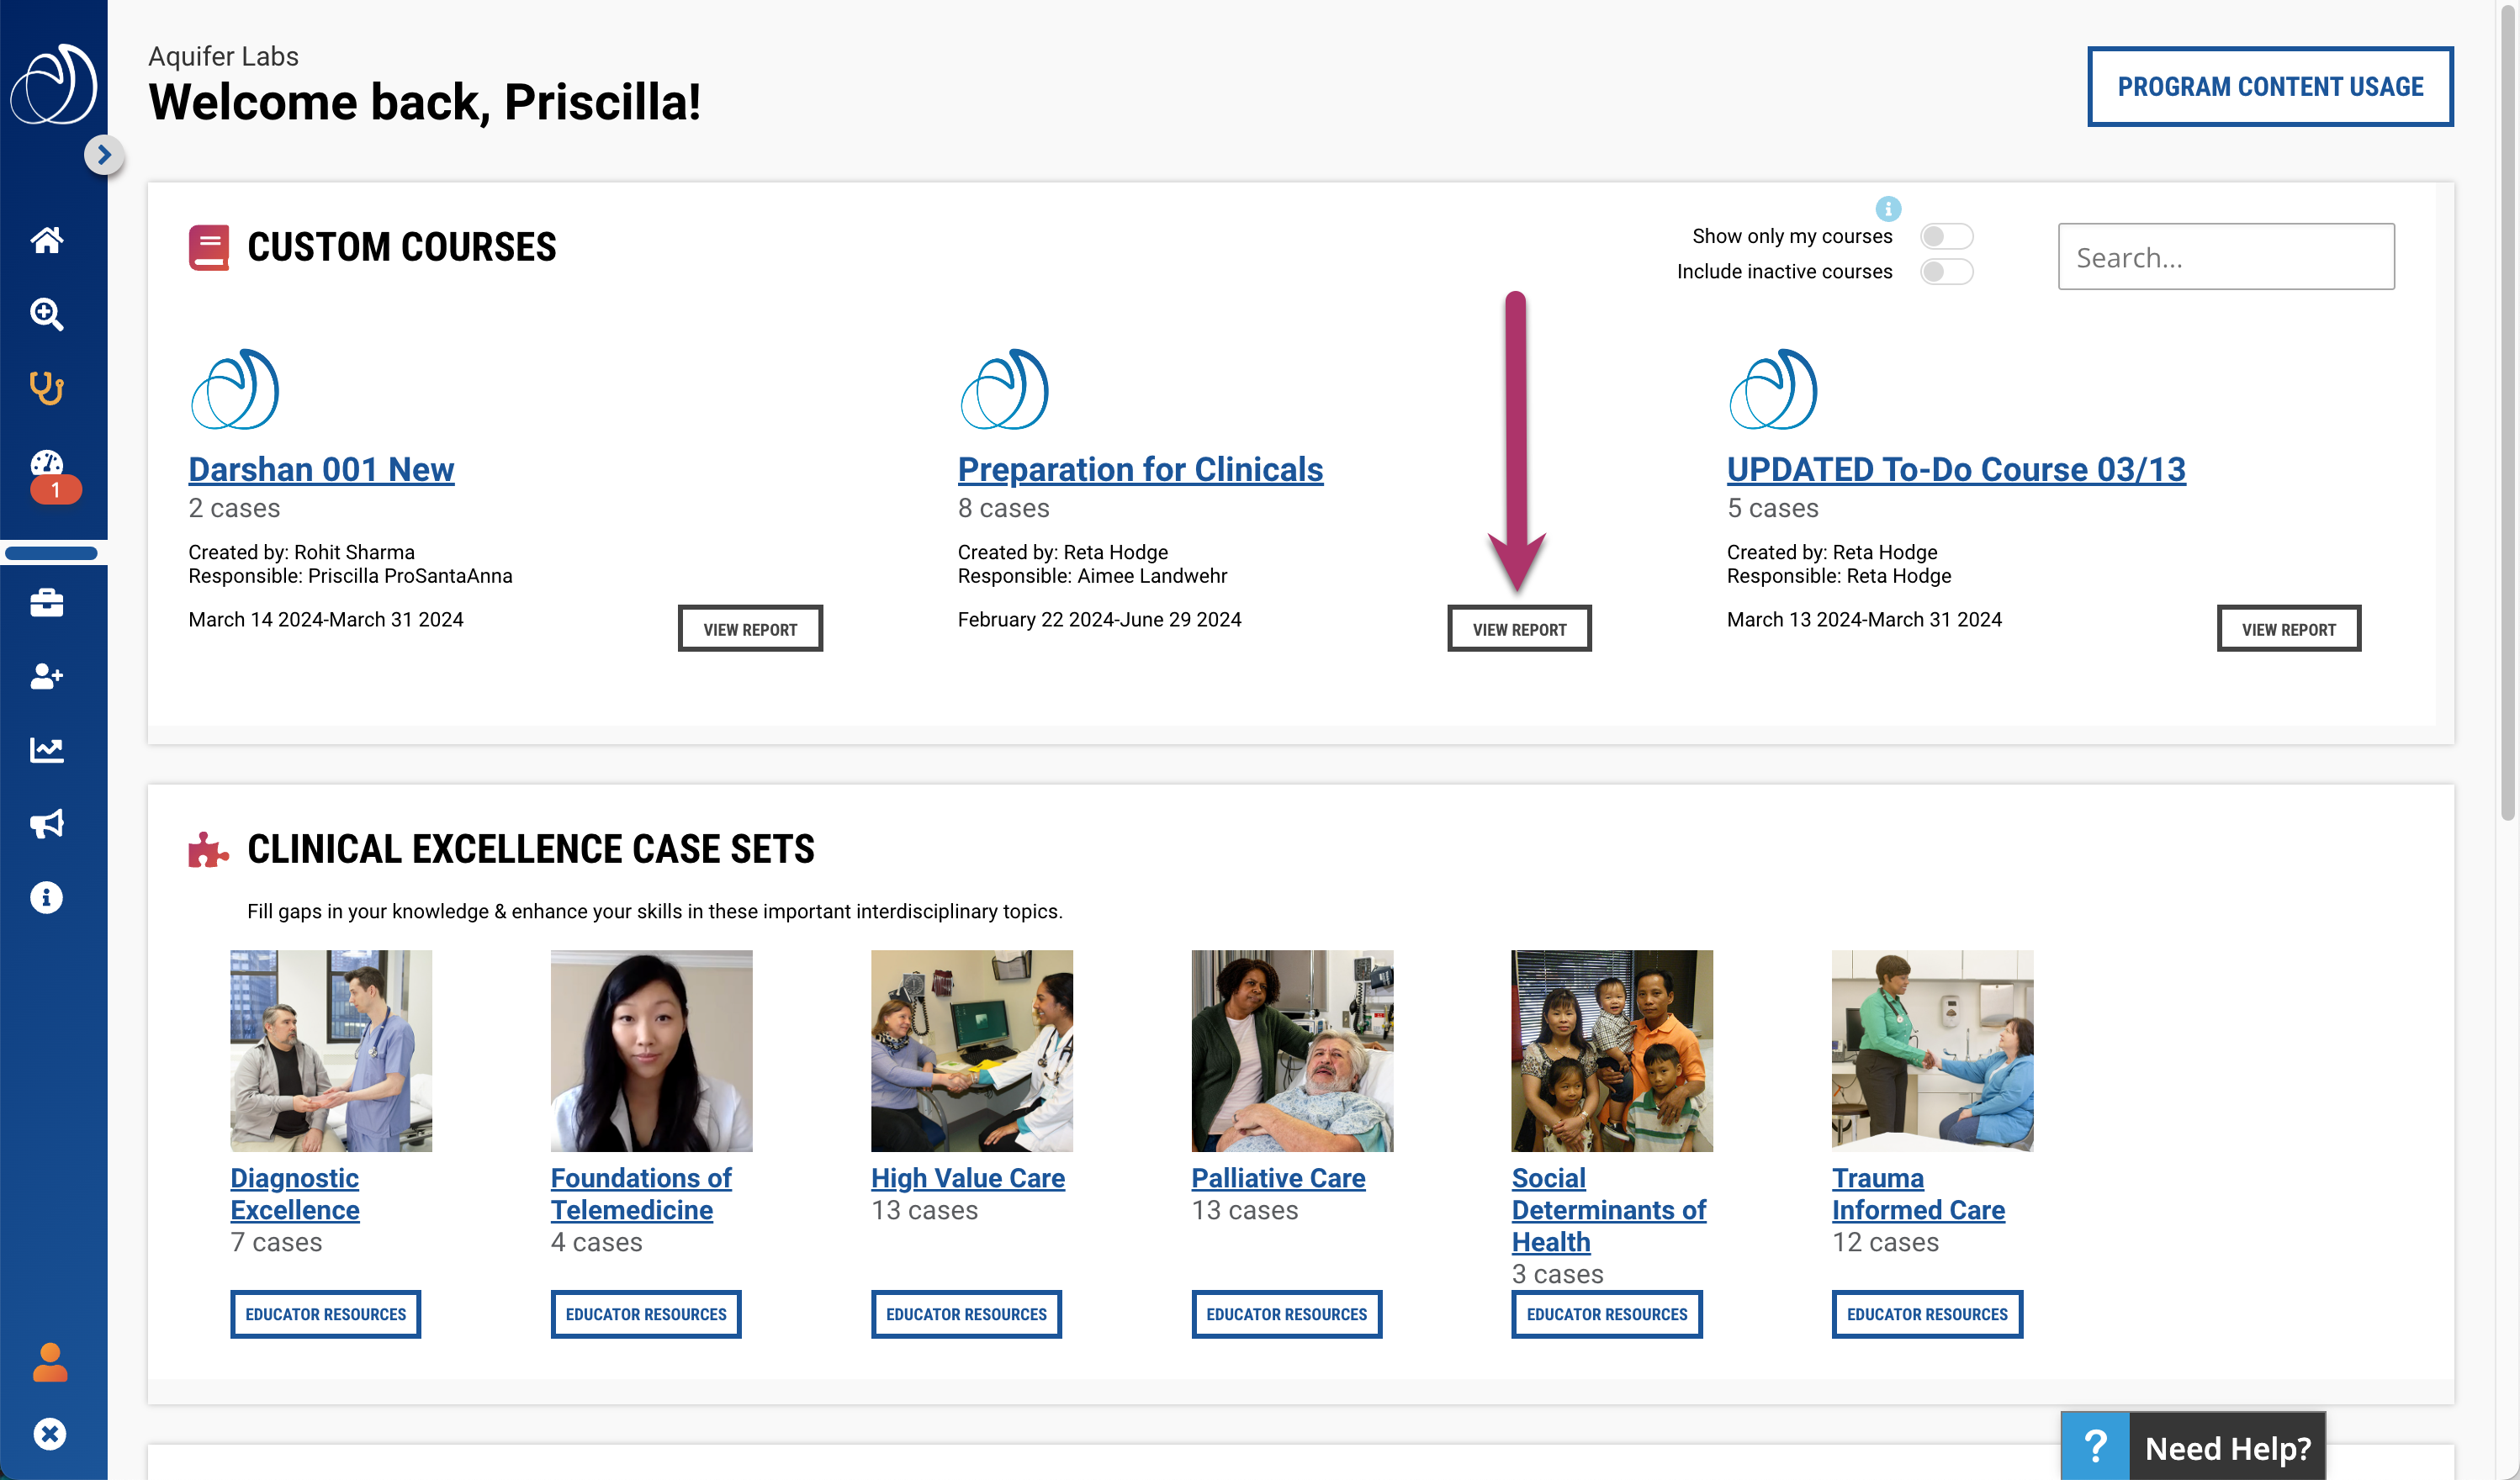
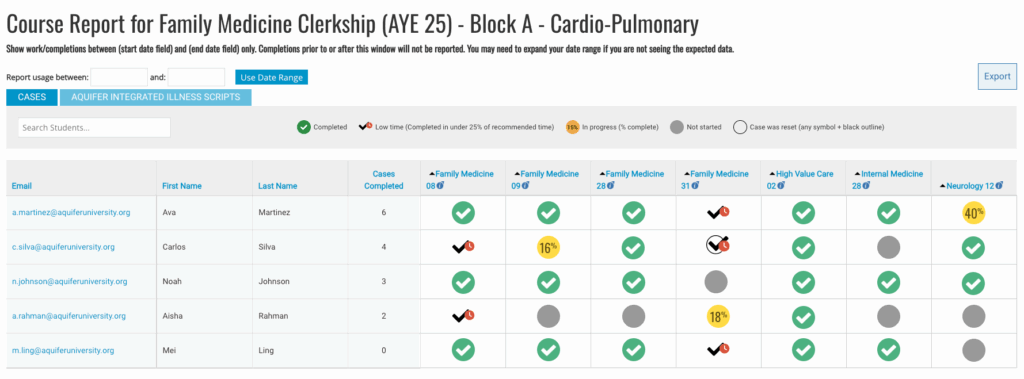
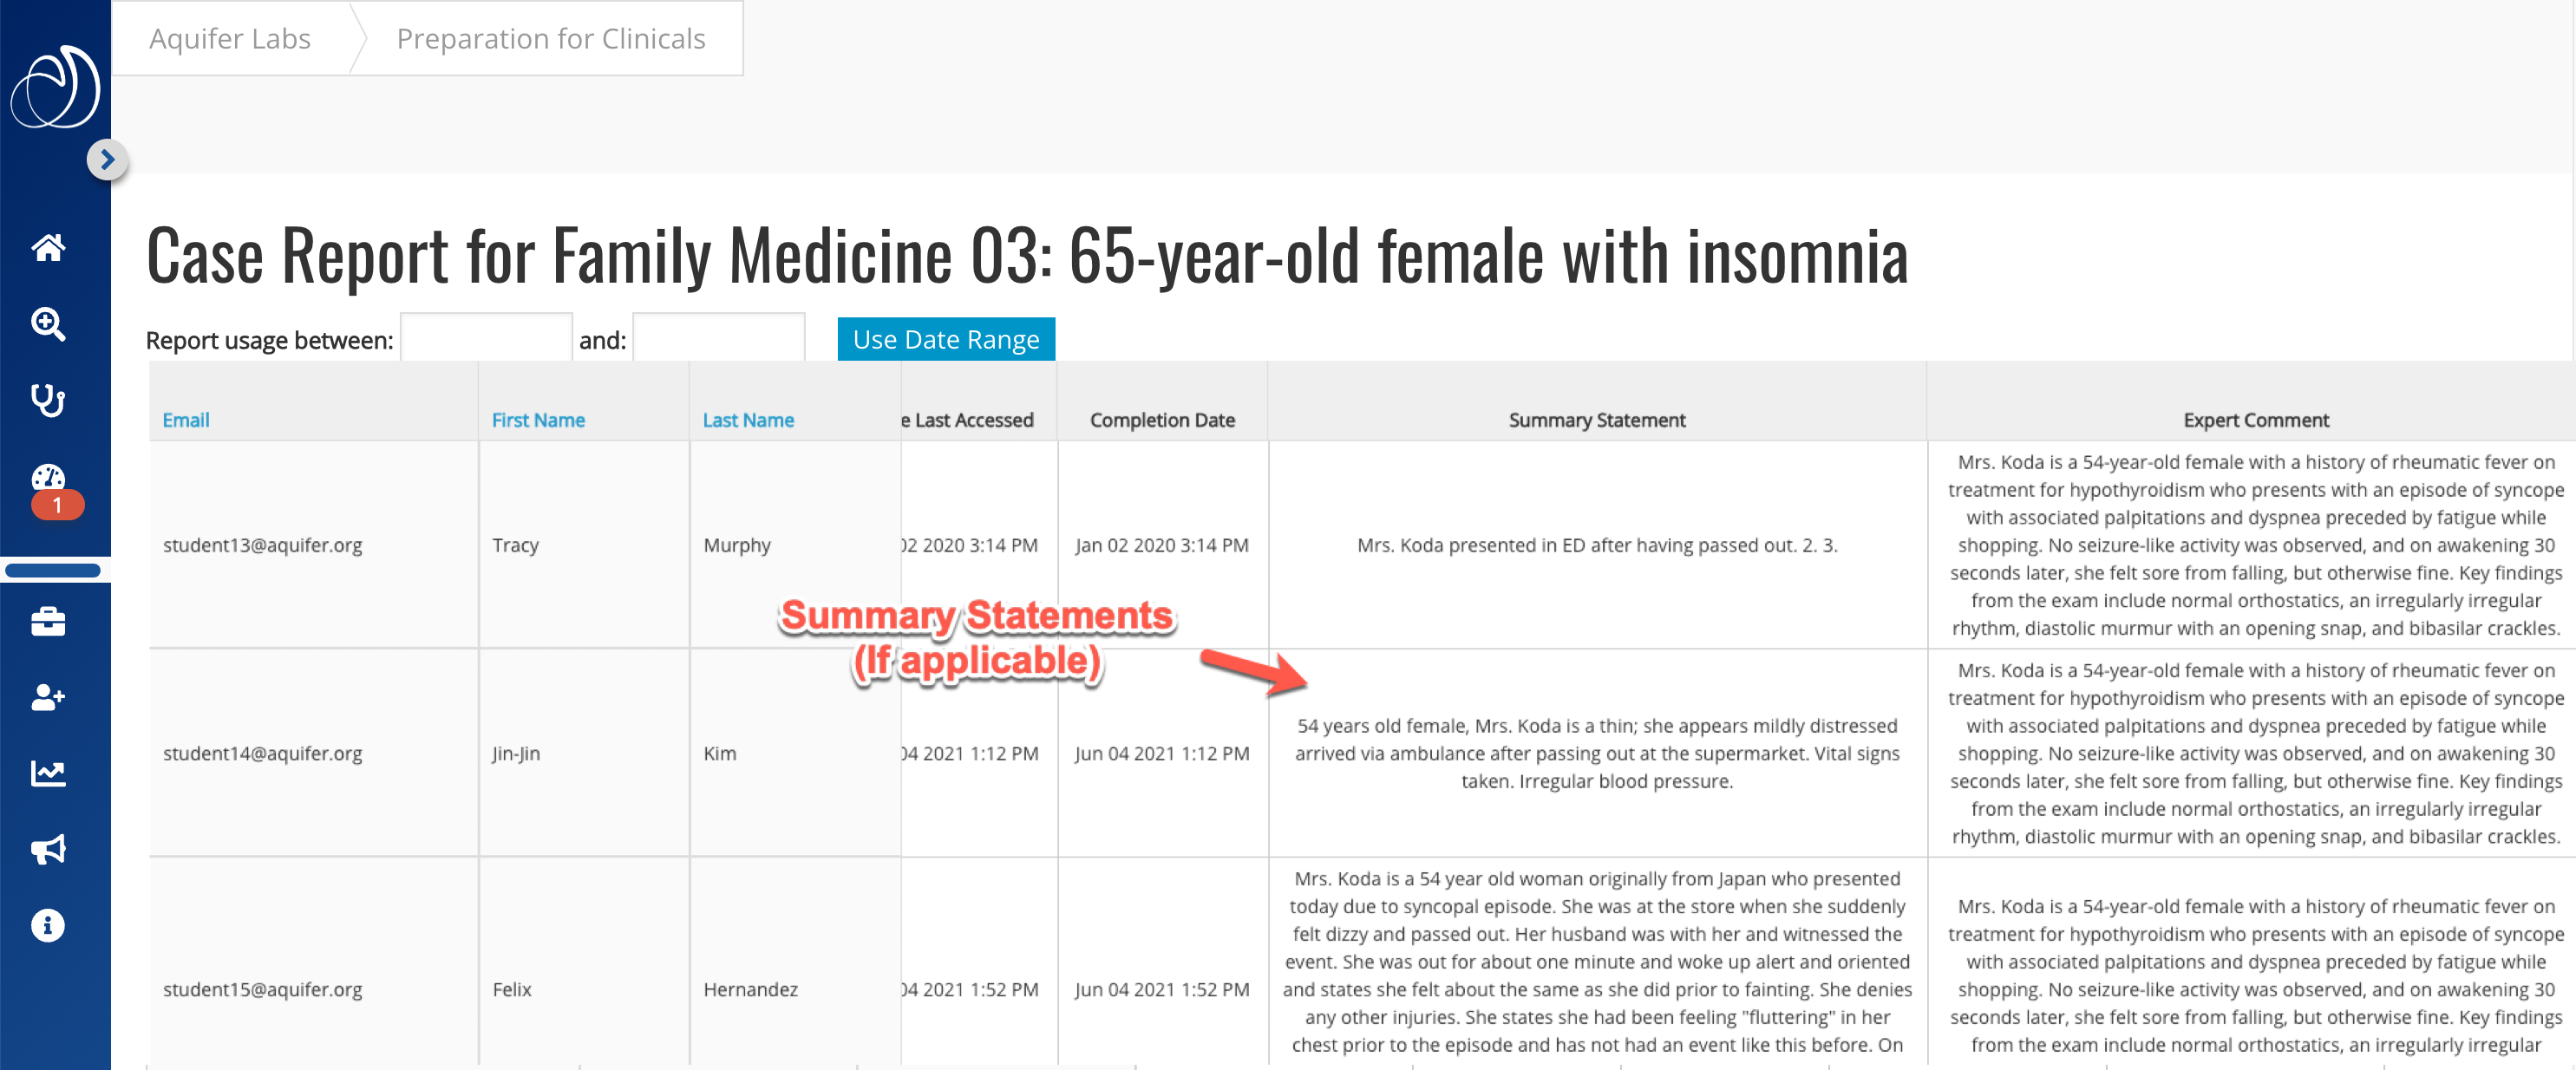
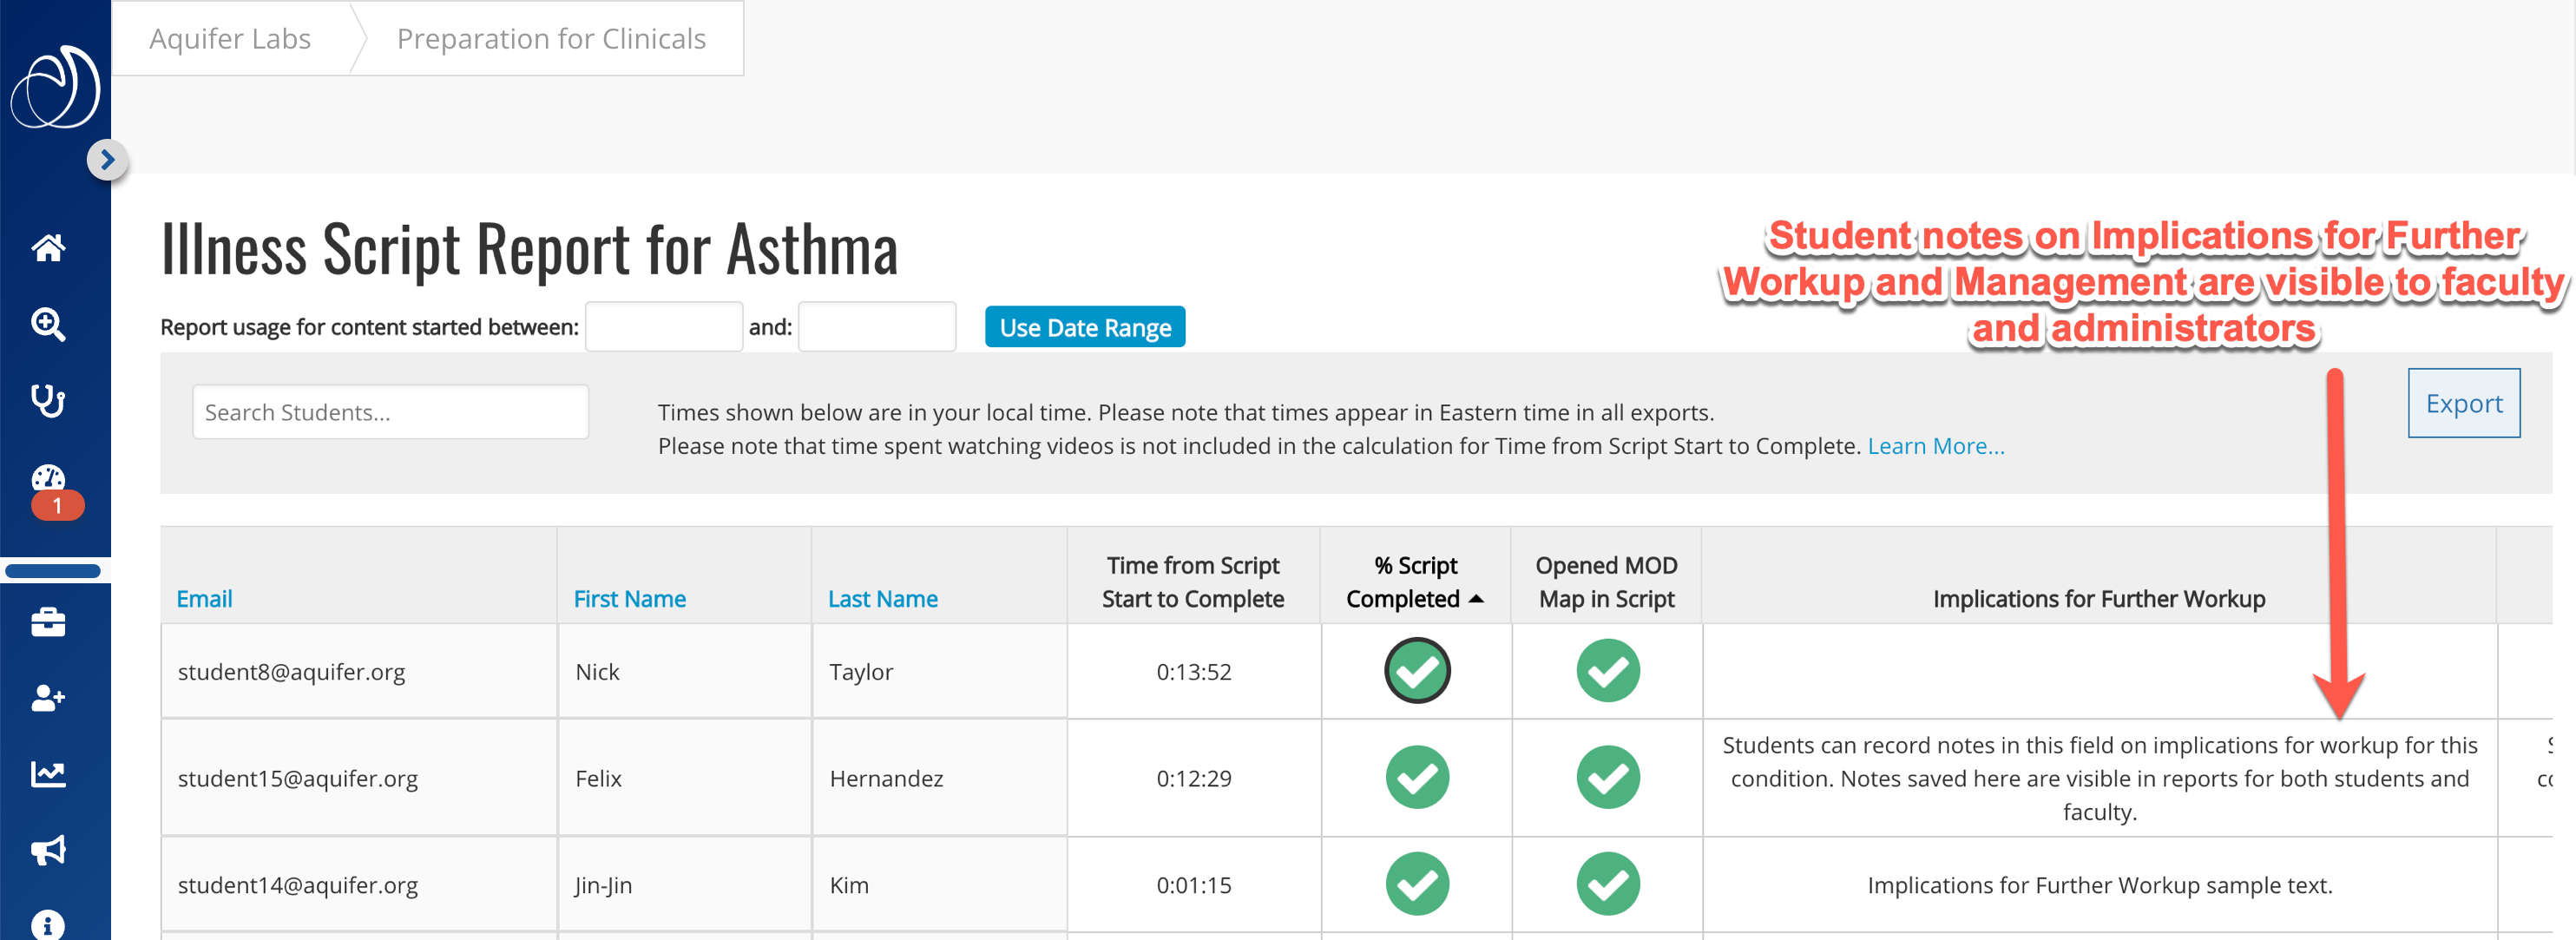
- Direct Navigation to Reports: Click the “Course Report” button to access detailed reports.
- Export Options: Select this to pull detailed reports for further analysis.
Snapshots and Trends – COMING IN JULY!
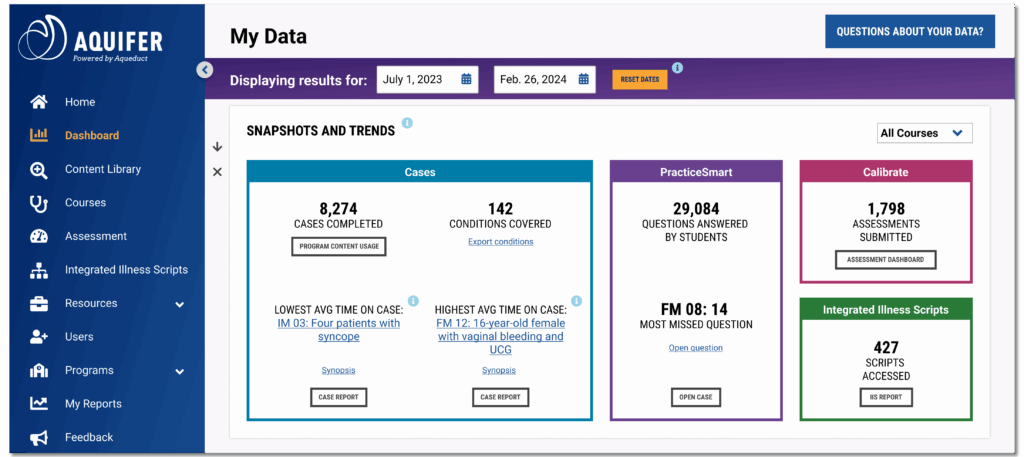
Your comprehensive overview of all Aquifer activity within your permissions.
Cases Section
- Total Completions: See overall case completion numbers.
- Conditions Covered: View a detailed list of medical conditions and diagnoses covered in your cases.
- Time Analysis: Identify cases with the lowest and highest average completion times compared to recommended times.
PracticeSmart Section
- Question Activity: See the total number of practice questions answered by your students.
- Performance Insights: View the most commonly missed question to identify learning gaps.
Note: When a course has fewer than 5 students, this block does not display any data.
Calibrate Section
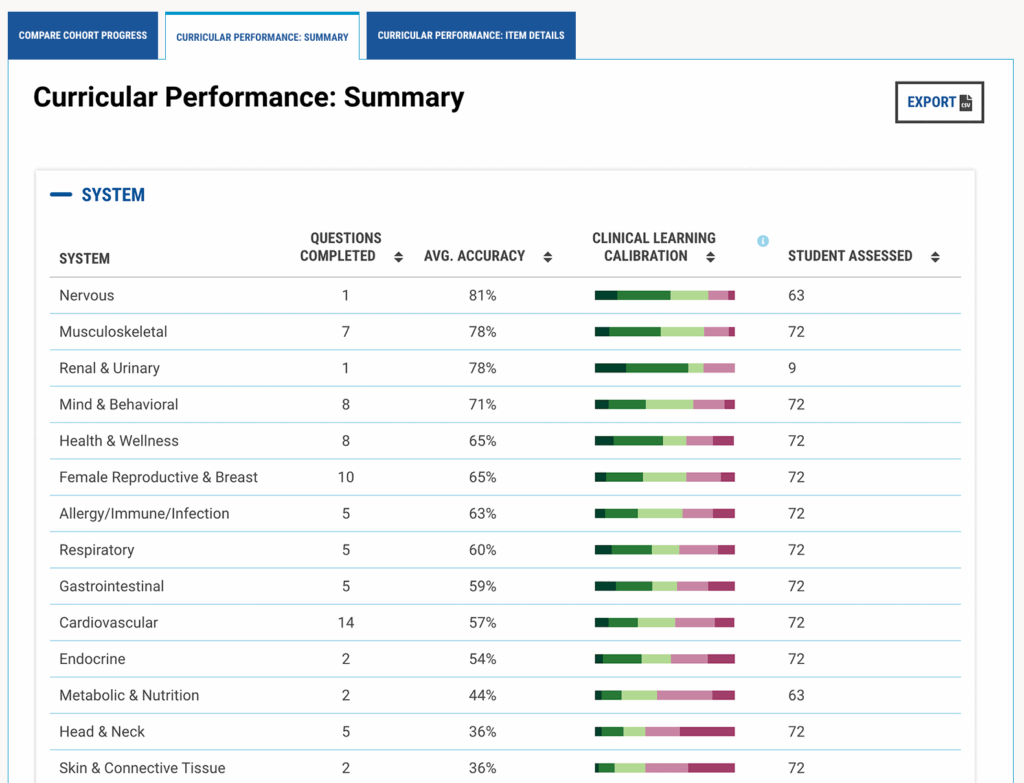
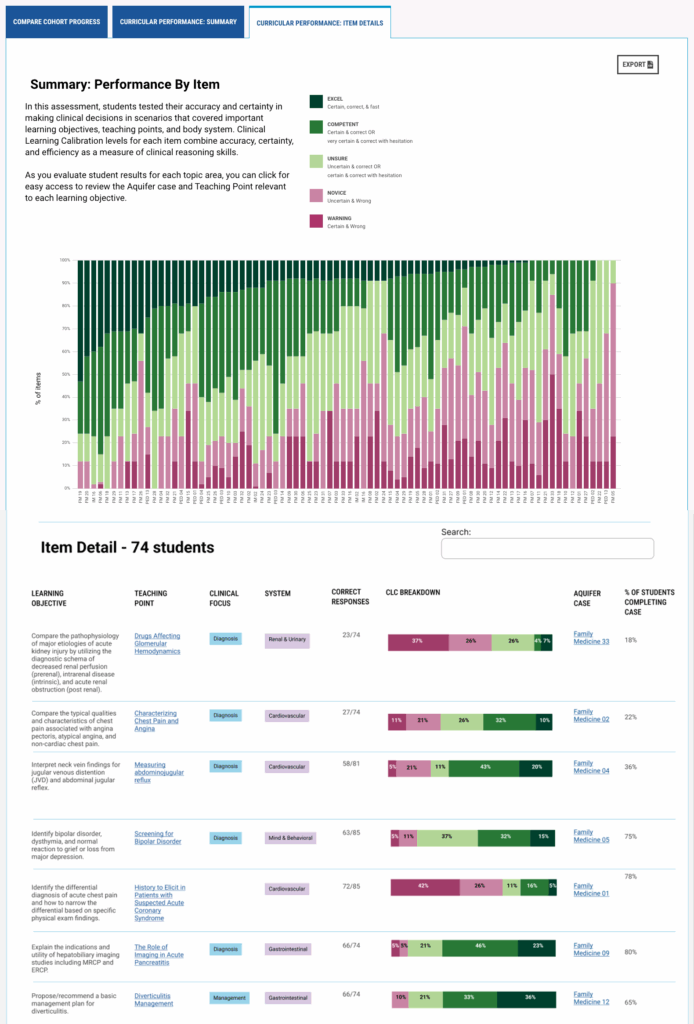
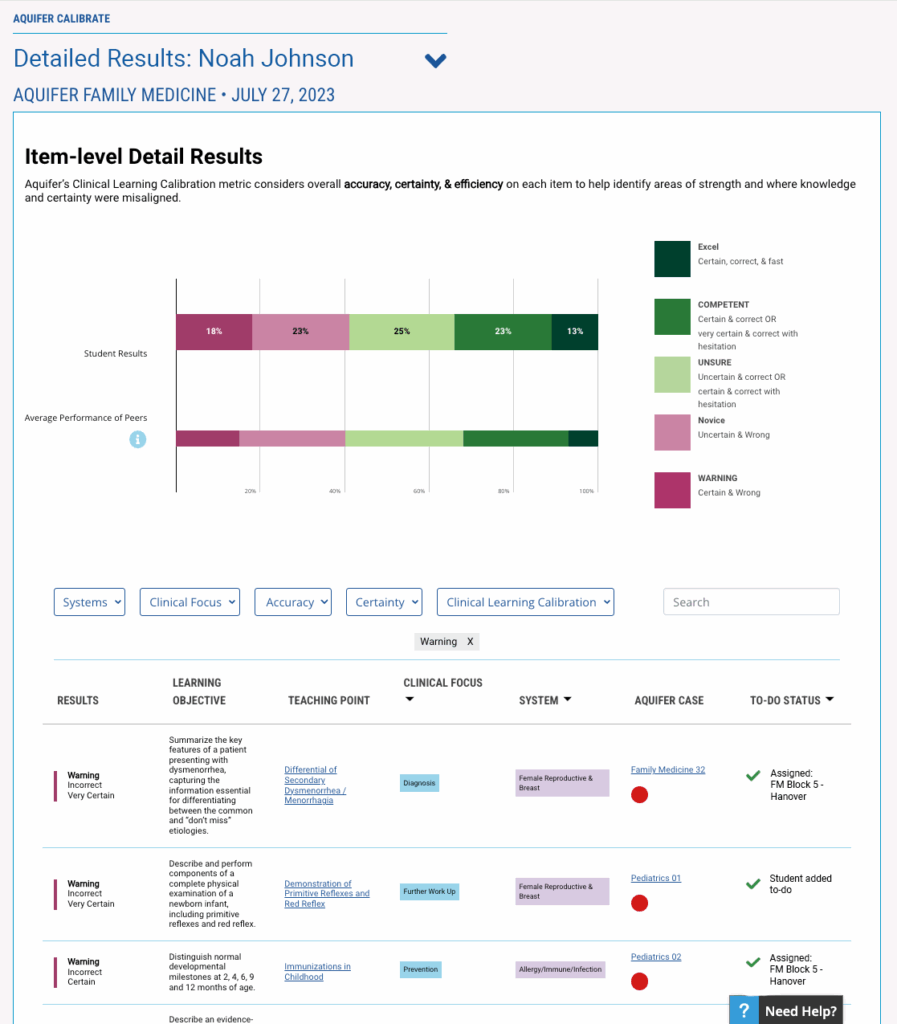
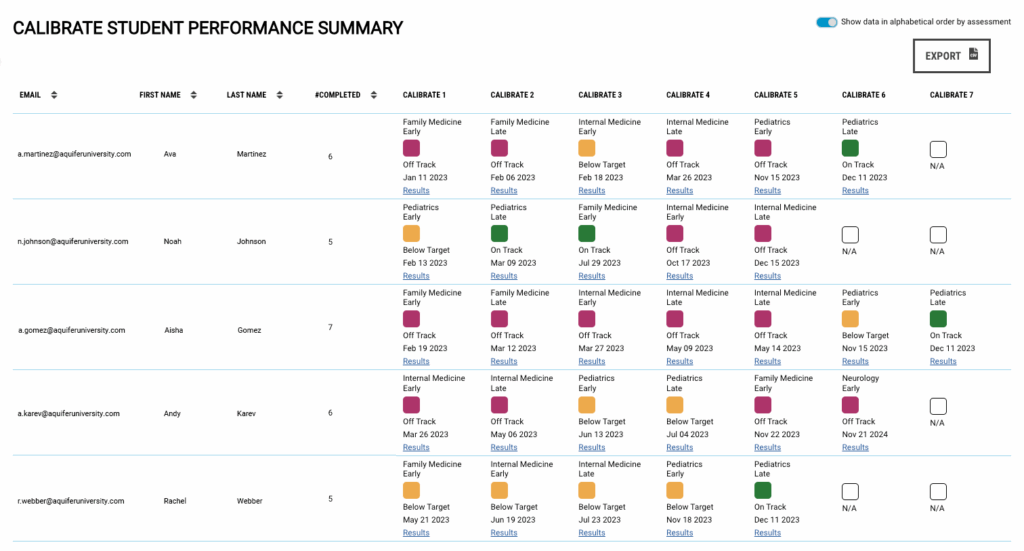
- Assessment Data: View submitted Calibrate assessments (if you have access).
- Integration Status: Learn about Calibrate availability for your courses.
Integrated Illness Scripts (IIS) Section
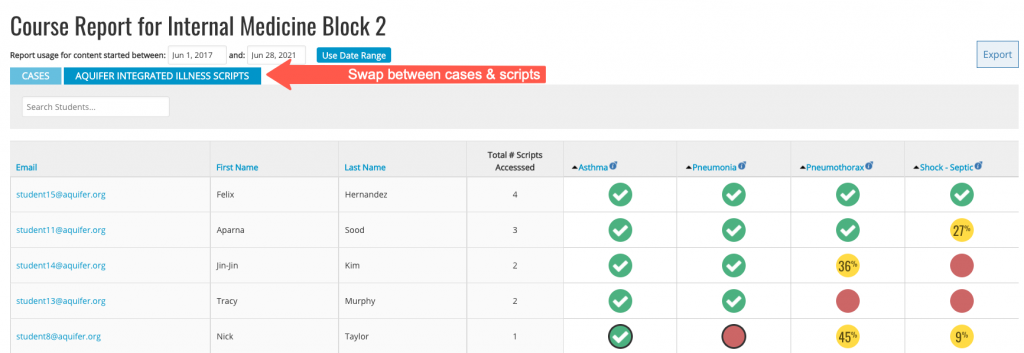
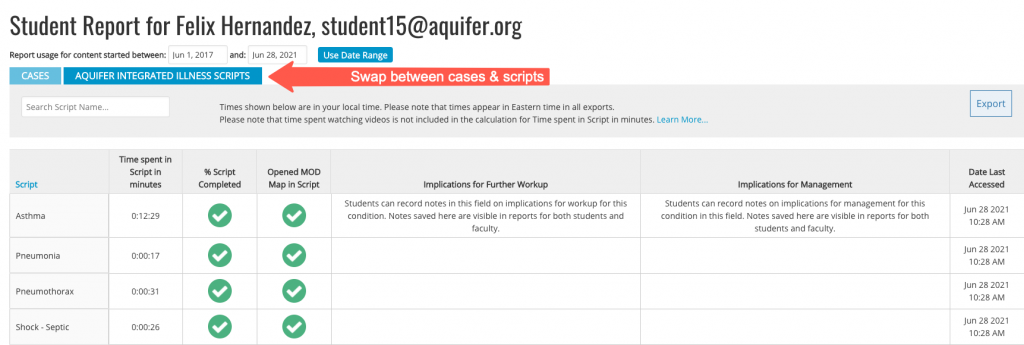
- Usage Tracking: Monitor how many IIS resources students are accessing.
- Course-Specific Data: See data available for courses containing IIS content.
Best Practices & Support
Optimizing Your View
- Regular Date Range Updates: Periodically adjust your date range to focus on specific time periods.
- Card Organization: Arrange cards in order of importance for your daily workflow.
- Course Selection: Use course filters to focus on specific courses or student groups.
Data Interpretation Tips
- Context Matters: Always consider the number of completions when interpreting time-on-case data.
- Trend Analysis: Look at data over time rather than single snapshots for better insights.
- Permission Awareness: Remember that your data view is limited to your assigned courses and roles.
- Faculty Engagement: Factor this in as it is important as a driver of student engagement, from onboarding to the use of cases and courses.
Getting Additional Support
If you need help interpreting your data or want to explore advanced analytics with support from the Aquifer team, click on the “QUESTIONS ABOUT YOUR DATA” button on the top right and select an option.
- FAQs Button: Check out the FAQs for quick answers to common questions.
- Schedule a Meeting: Book a consult with our Adoption & Use team for support implementing Aquifer and leveraging your data.

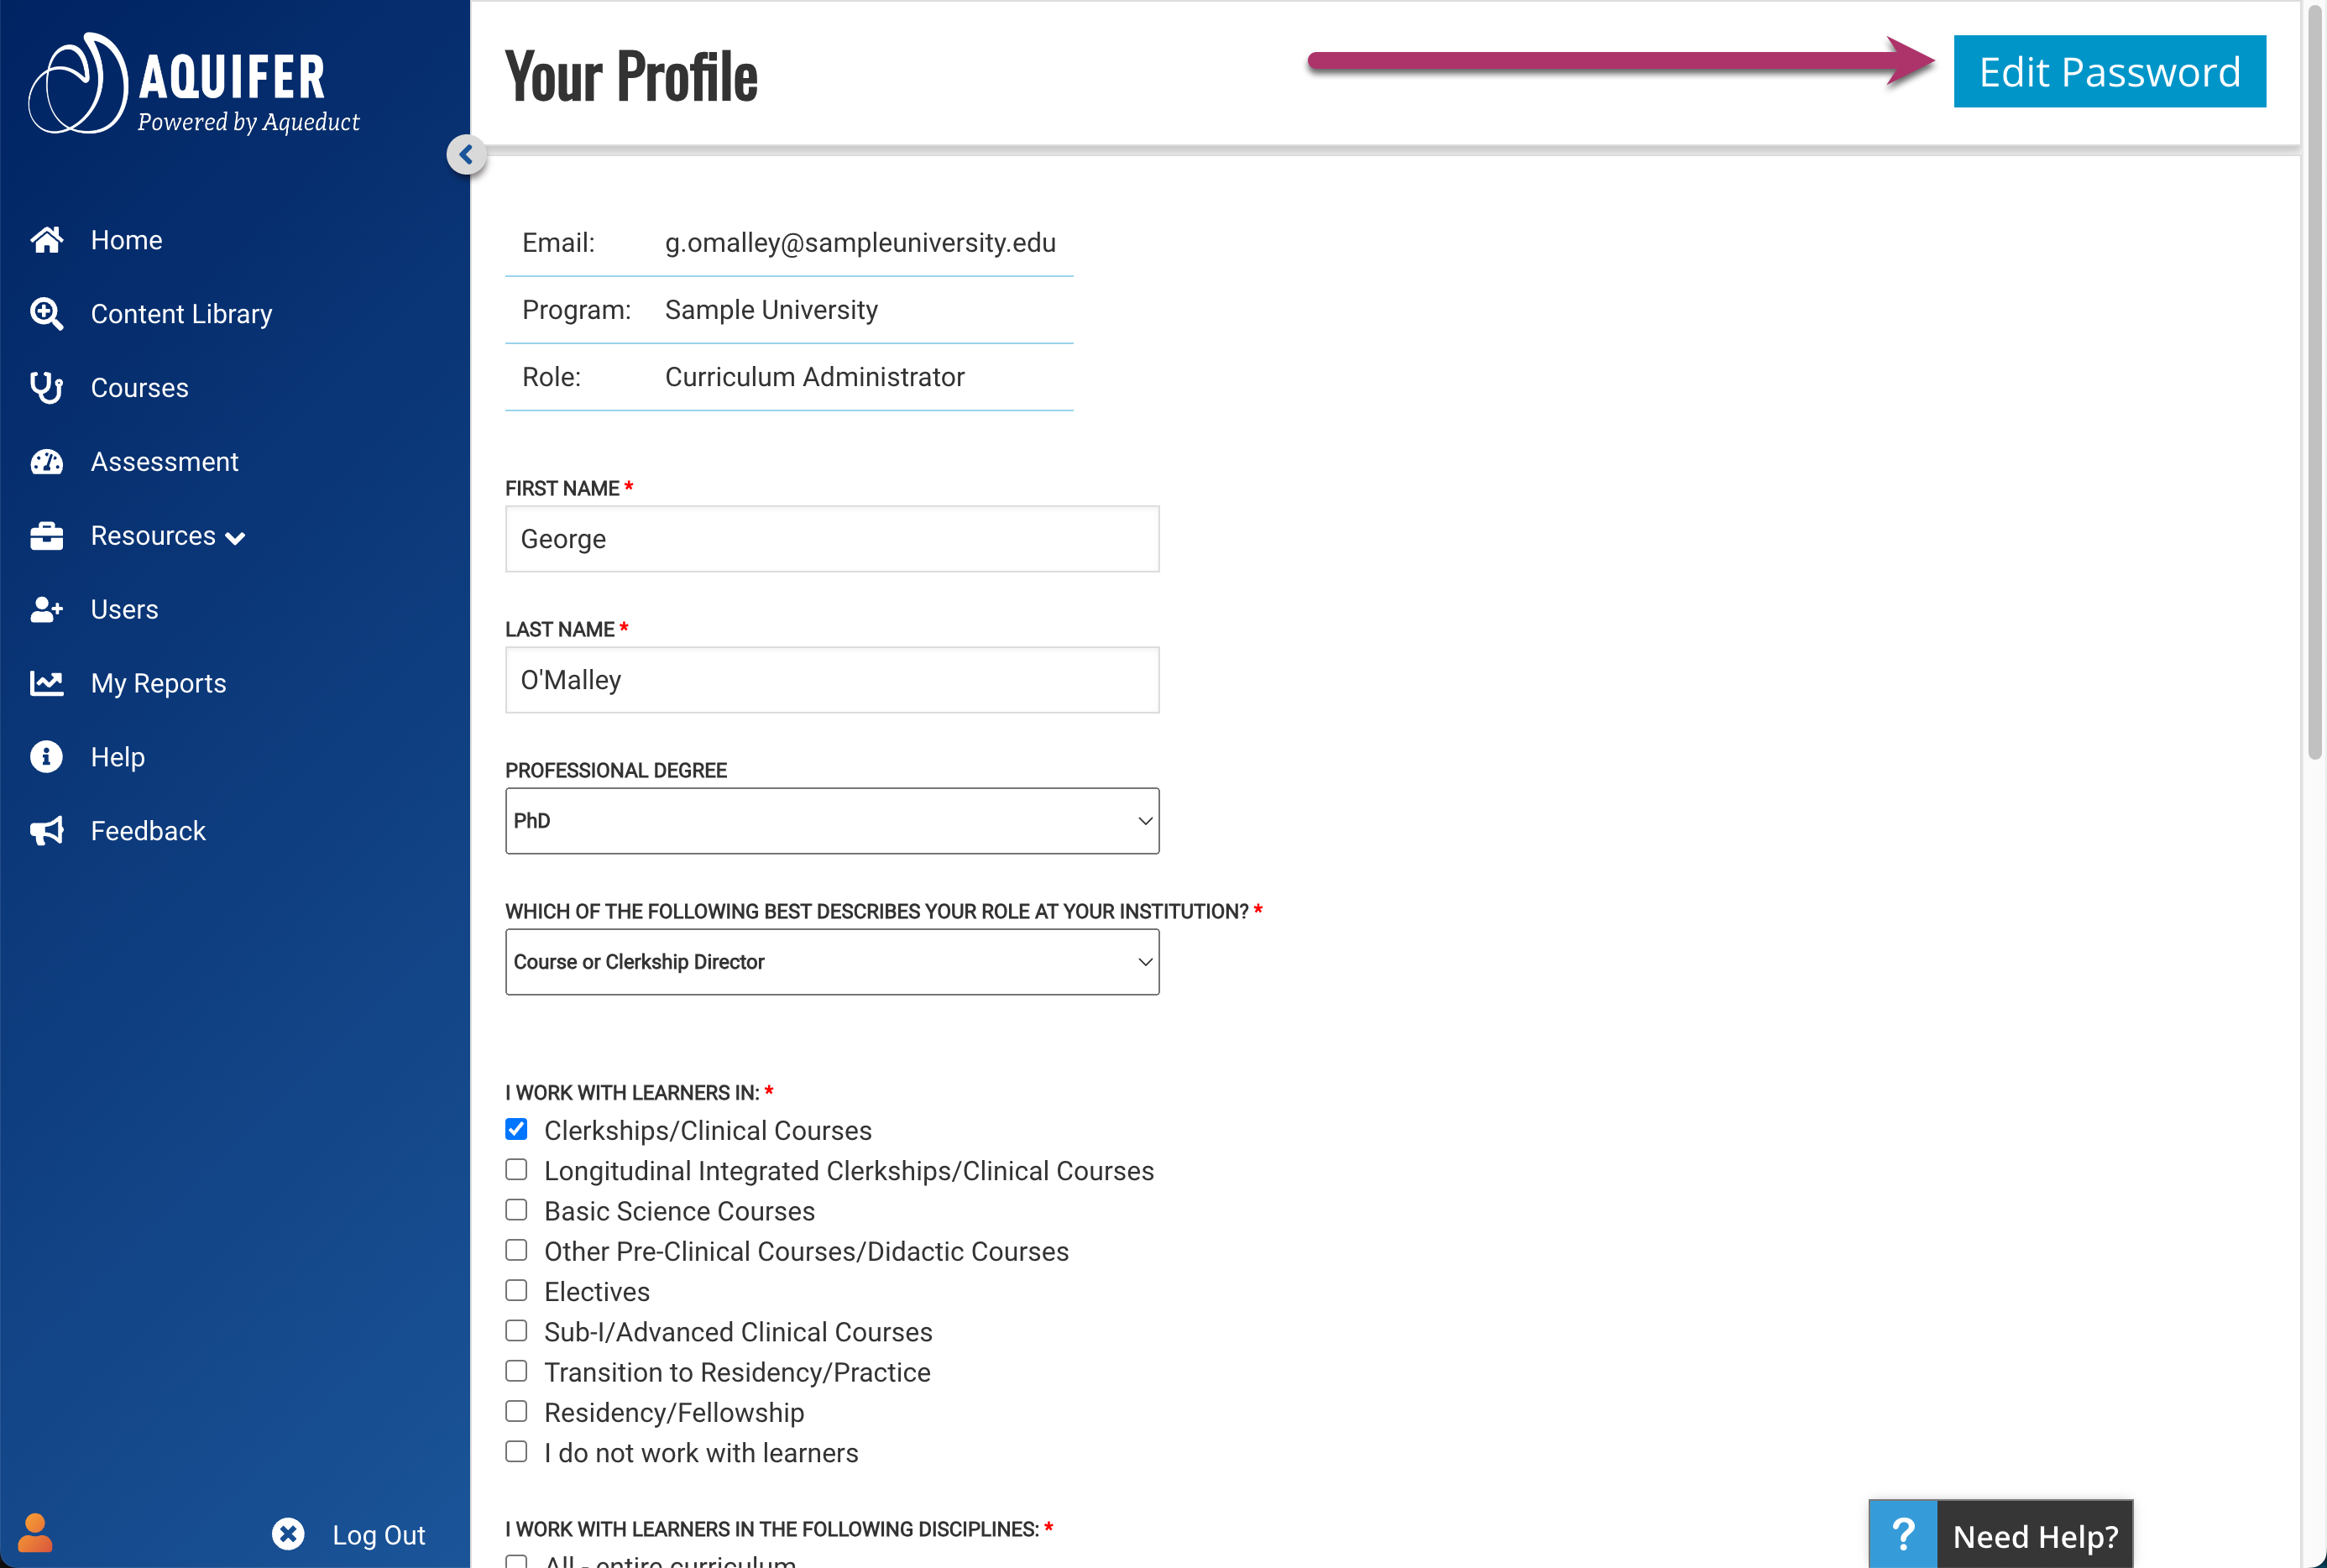
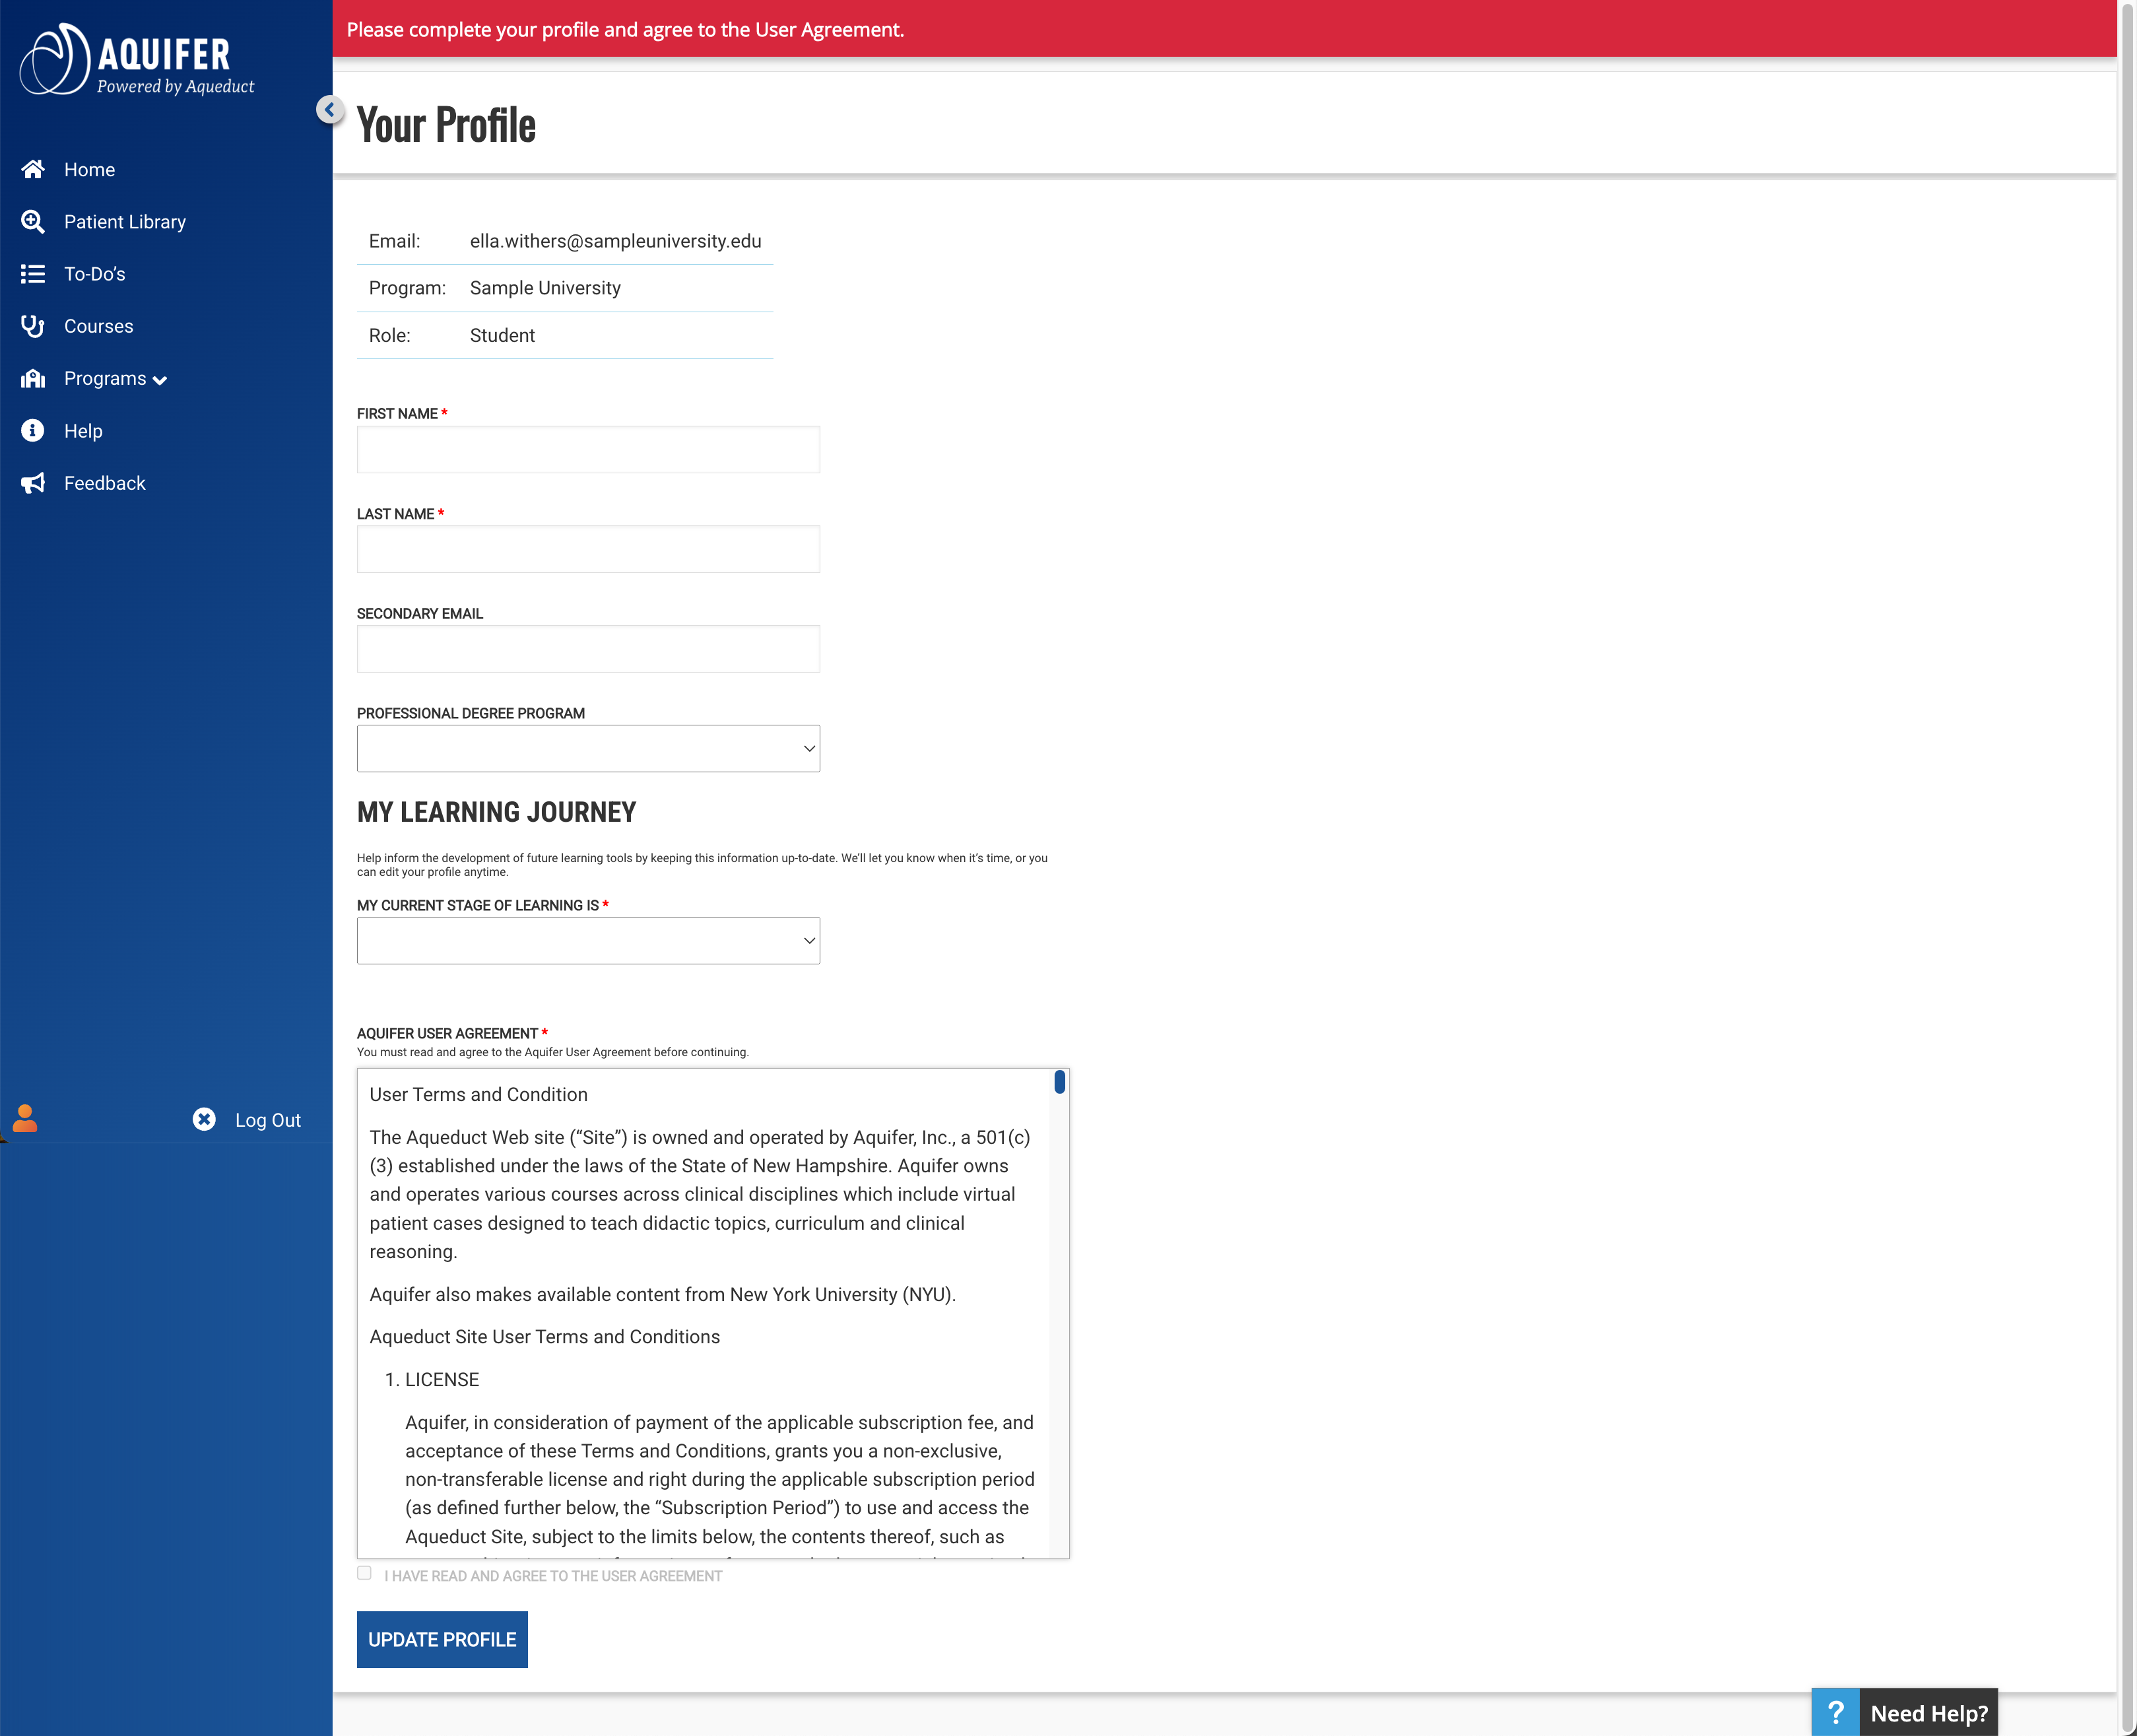
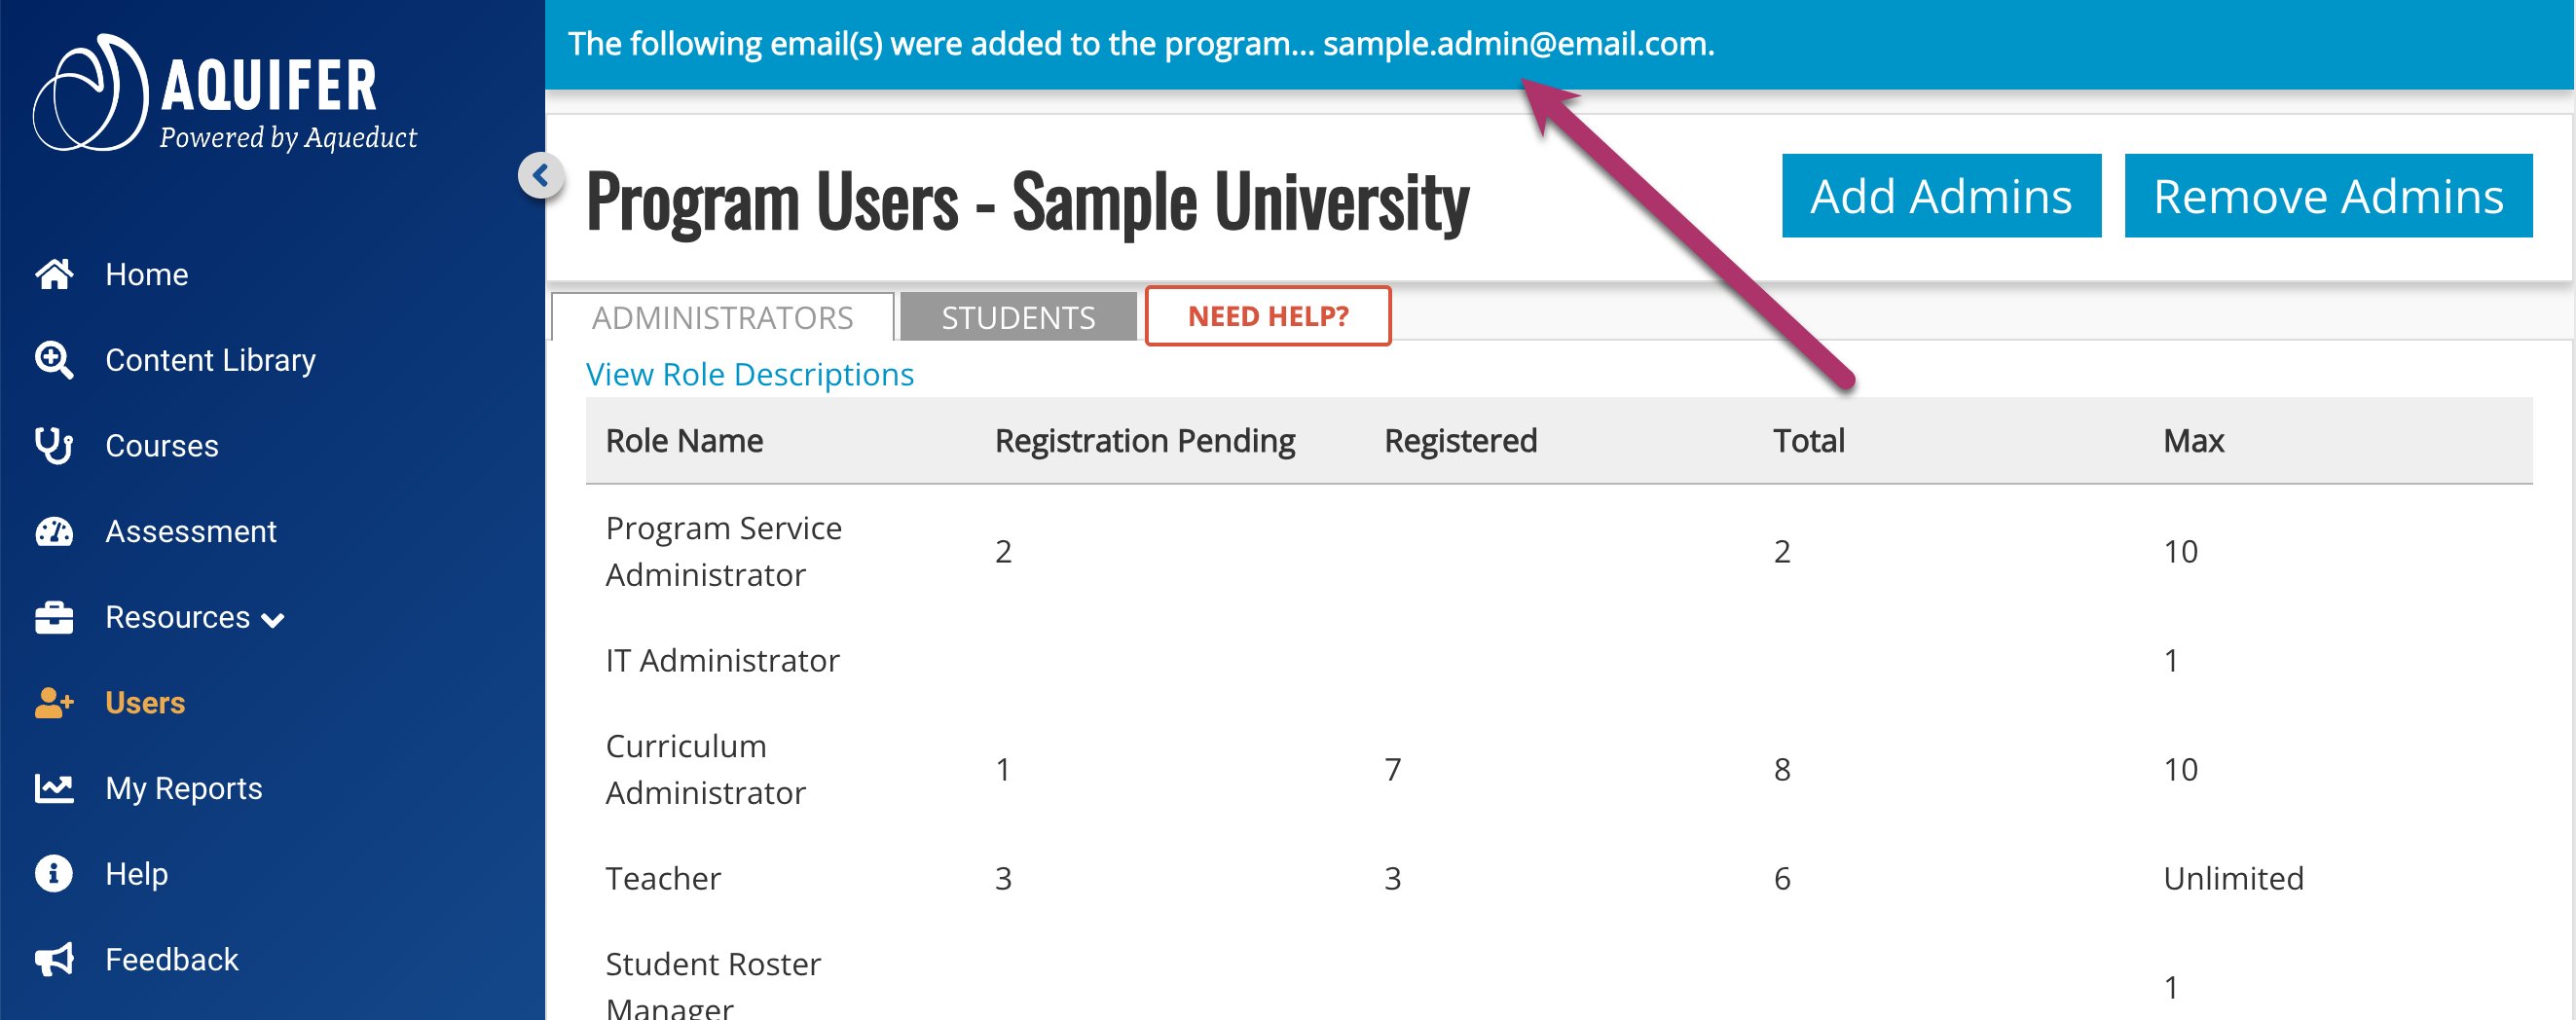
For role-specific questions, see our article on Roles & Permissions or contact your institution’s Aquifer administrator to request updated permissions. Your Aquifer administrator’s name and email address can be found on your profile screen by clicking the user avatar in the lower left corner of the navigation bar.











 Click
Click 
