Aquifer has wrapped up a seven-month pilot of Aquifer Calibrate, our new formative assessment system for clinical mastery, and is ready to release the system for general use. Based on pilot feedback, the system has been optimized, including improved reports for students, faculty, and coaches, and new student to-do lists to support their embedded learning plans. Aquifer Calibrate will be included free of charge with all subscriptions to Aquifer Family Medicine, Internal Medicine, Pediatrics, and Radiology beginning July 1, 2023.
About Aquifer Calibrate
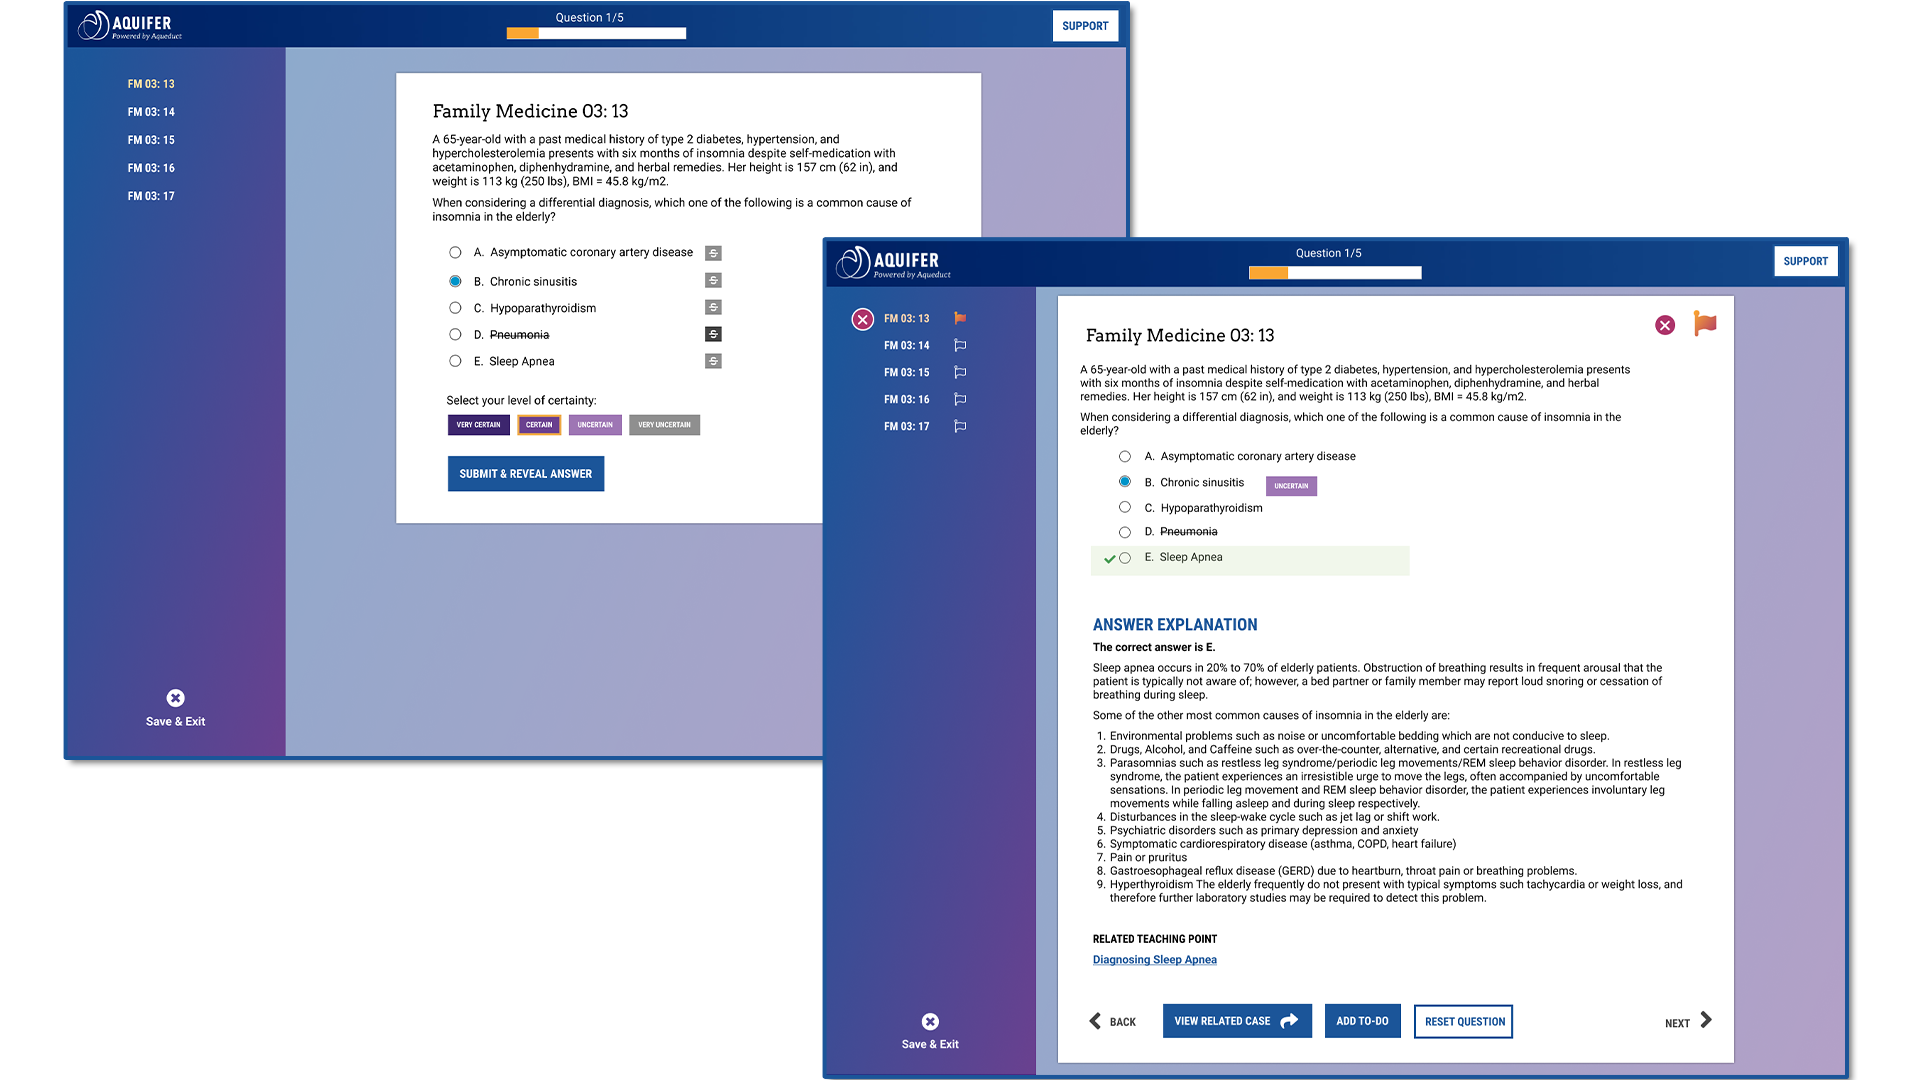
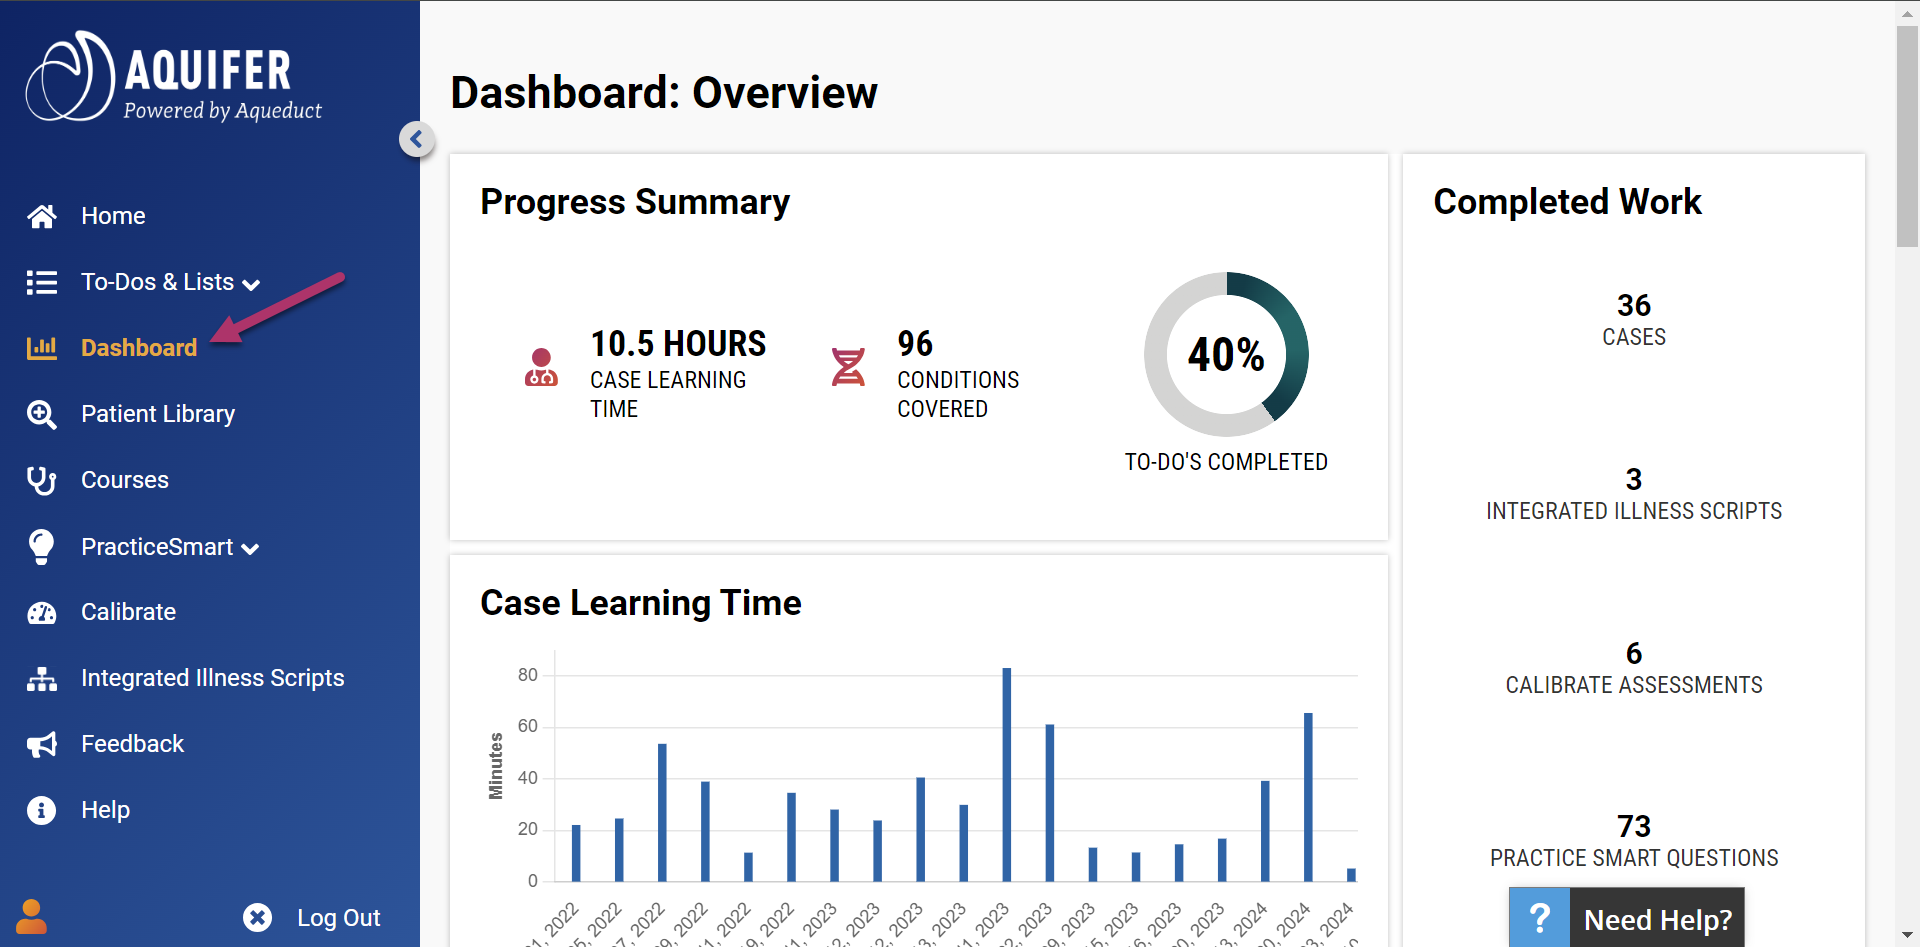
Calibrate was developed to meet the needs of our customers by providing formative assessments to students via a stable online platform that will allow students to assess their competence and learning progress and allow faculty to make informed decisions on their curriculum.
These assessments and reports focus on Clinical Learning Calibration to demonstrate whether students, through case learning, are competent and confident in their skills and whether a school’s curriculum and teaching are effective. As a result, Aquifer builds students’ essential knowledge, clinical reasoning, and decision-making skills.
About the Aquifer Calibrate Pilot
Between September 2022 and April 2023 37 health care education programs participated in a pilot program, including
- 21 MD programs
- 2 DO programs
- 8 PA programs and
- 6 NP programs
There were a total of 1038 individual exam administrations during this time period, including:
- 730 administrations at MD/DO programs
- 358 administrations at NP/PA program
A psychometric analysis of the four assessments was conducted, and the exams were found to be statistically reliable and valid. We currently are conducting a comparative analysis of the MD/DO and NP/PA results to determine how best to optimize the assessments for each cohort.
Ultimately, the assessments were found to be valid and accurately measured students’ knowledge and progress over time.
Pilot Feedback Tools and Other Outcomes
Feedback on the pilot program was collected in the following ways:
- Early assessment survey;
- Late assessment survey;
- Student advisory groups;
- Student product interviews
- Calibrate learning plan coach survey;
- Calibrate clerkship lead survey; and
- Feedback that pilot programs provided to peer trainers.
Participants in the pilot were asked to administer the assessment to their students and make coaches available to meet with their students based on the Calibrate results. Key takeaways from the pilot:
- Participants found the system easy to use
- The majority of students met with a coach at least once
- Students saw value in:
- Identifying knowledge gaps;
- Rating confidence and calibrating knowledge and certainty;
- Access to additional practice questions; and
- Links directly to Aquifer content.
- Identified areas for improvement:
- Students had difficulty understanding the reports.
- Training materials for coaches on how to use Calibrate results to coach a learner were insufficient.
- As a result, students thought their conversations with their coach/faculty/residents based on their Calibrate results could have been more impactful.
How We’ve Used This Feedback to Improve Calibrate
The pilot feedback has been incredibly valuable in helping the Aquifer product team redesign the reporting and results workflows for students and administrators, and develop additional tools to support students, coaches, and faculty. Improvements coming for July 1 include:
- Redesigned easier to understand and act on learner
- Embedded Build Your Own Learning Plan tools for students,
- Improved coaching reports and new support tools for coaches to enhance coaching conversations
- Optimized faculty reports to help faculty use reports to identify at-risk learners and identify curricular gaps
- New training and onboarding materials for students and faculty.
For more information, click here to see a video overviewing the changes (view time 4.6min at 1.5x speed). You can also access a clickable tour of new student and coach report views here and the new faculty views here.
Aquifer Calibrate Post July 1
All institutional subscribers to Aquifer Family Medicine, Internal Medicine, Pediatrics and Radiology, Curricular Partners and Limited Subscribers included, will have access to Aquifer Calibrate automatically included as part of their subscriptions beginning July 1, 2023.
Calibrate access is FERPA-compliant. Once assigned an Aqueduct role with Calibrate access, your faculty and staff will be able to easily schedule exams by logging into Aqueduct, clicking “assessments” from the top menu, assigning students you want to take the exam, and then schedule the assessment. Once submitted, students receive an automated email directing them to login and take the exam.
We are just at the beginning stages of incorporating Aquifer Calibrate into the Aquifer Learning System and will continue to optimize Calibrate going forward, including the following plans, which are already underway:
- Expanding peer-to-peer training opportunities for coaches
- Offering actionable next steps from student results in the form of a to-do list
- Providing opportunities for additional assessment questions for further practice based on student reports
- Exploring AI-driven optimizations to Calibrate
- Building Calibrate assessments for additional Aquifer Courses
- Responding to ongoing faculty and student feedback
- And much more.
Please feel free to reach out and share any additional feedback you have at any time. We’d love to hear from you at exams@aquifer.org.